

THE WEEKLY TOP 10
I have only taken a handful of days off this year, so with our son and daughter in-law visiting us this week from out of town, I took Thursday & Friday off. Therefore, this weekend’s piece is going to be a shortened one (with just 5 bullet points.) HOWEVER, I have provided A LOT of charts this weekend…which could turn out to be extremely compelling, so I think you’ll find this weekend’s piece quite interesting……Thank you very much.
THE WEEKLY TOP 10 (“Top 5” this week)
Table of Contents:
1) You can’t get there from here. (Use a Maine accent, it’s much better that way.)
2) The Fed almost always does what they tell us they’re going to do!
3) A LOT of MACD charts look VERY dicey right now.
4) Watch out if the U.S. 10yr yield moves above 3.1%.\
5) Summary of our current stance.
1) If demand destruction is going to be strong enough bring inflation down (by making it impossible for businesses to keep passing on their costs to the consumer), how are earnings go to remain strong enough to support a further rally than we've already seen this summer?
It has been said that we use a lot of common sense in our analysis. Maybe that’s a bad thing. We all know that there are certain rules about the marketplace that don't make a lot of sense...but have been proven to be very good rules over the years. have been battle-tested as being very accurate over the years…but don’t make a lot of sense. (If you never spent any time learning about the markets, you'd assume that a high level of bullishness was a positive development.).....However, we do believe that Wall Street tends to make things seem much more complicated than they really are much of the time. Therefore, using common sense has worked very well for us over the years.
With this in mind, one of the reasons why we remain quite skeptical about the chances that the stock market can rally a lot more than it already has this summer is that that the number one reason why the market has been rallying recently simply doesn’t make a lot of sense.
The number one reason we're talking about is the belief that the Fed is going to completely "pivot" sometime early next year and start cutting rates. Sure, they might indeed pivot next year, but that is not a reason to be bullish on the stock market in our opinion.
We just don’t think that it makes a lot of sense to think that demand destruction is going to be enough to cause the Fed to pivot…but at the same time, it will leave the economy strong enough to take the stock market a lot higher from current level…even though it has become very expensive once again.
We have a hard time coming to grips with the thought that if the Fed ends their rates hikes soon (after the next meeting), it will still cause inflation to drop to a level that is anywhere near their 2% target. (Sure, maybe they'll raise their target level, but they're not going to raise it to something up near 5% or more!) So, if they're going to have to continue to raise rates, it will continue to have a negative impact on demand. (Just look what it is starting to do to the housing market.) If demand destruction is going to have to become more powerful, how is the economy going to be able to grow enough to create a further rally in the stock market? Put another way, if demand destruction is going to be strong enough keep businesses from passing on their costs to the consumer (and thus bring inflation down), how are earnings go to remain strong enough to support a further rally than we've already seen this summer?
If the stock market was trading at 14x earnings or 1x sales (like it usually is at a bear market bottom), we would not be as concerned as we are right now. We’d be able to look over the valley and see a situation where the worst of this economic slowdown was not too far off...and thus the downside for the stock market was rather limited. However, since it is trading near 19x forward earnings and 2.5x sales, it has not priced in the inevitable slowdown that we're very likely going to see...and thus the market's upside potential from current levels is extremely limited in our opinion.
You cannot magically push inflation down to where the Fed (and most everyone else) wants to get it...without causing the kind of economic deceleration that will cause earnings to decline in a meaningful way. If earnings are going to decline...like we think they will...not only is this expensive stock market going to very little upside potential...it's going to have a decent amount of downside potential.
The bounce in the stock market that began in June...started due to the fact that the market had become oversold, over-hated and over-shorted. It has received more help with the decline basically all commodity prices...especially crude oil. However, even though crude is still near its summer lows, most other commodities have seen meaningful bounces over the past few weeks...and all of them (INCLUDING OIL) are still WELL above their levels from a year ago.
In fact, one could certainly argue that the pullback in these commodities...has actually made the Fed's goal of reining-in inflation a HARDER one...because it has led to such a strong bounce in the stock market. Strong sock market rallies do not lead to demand destruction...and a slowdown in inflation…..I went to college in Maine. One of the great old sayings that is used (with a thick Maine accent) up in that part of the country is, “You can’t get there from here.”…..Looking over the valley is great, but what if that valley is a lot wider than people realize???
2) We’re not so sure why so many people still believe that the Fed does not have the guts to keep raising interest rates if inflation remains high…even if it hurts the economy. They’ve been saying that they will indeed do this…and they’ve usually done what they say they’re going to do.
In December of last year, we said that the Fed was telling us that the good old “Fed put” had been moved out to a level that was much more “out of the money” and that they no longer “had investors’ backs” to the degree many thought they did. Very few pundits agreed with us back in December, but it only took a couple of months for them to come around to our position.
However, when the stock market started rallying from a very oversold level (and from a situation where sentiment was extremely bearish), many of them decided once again that our central bank would reinstate the “Fed put.” They believed that they Fed would not let the economy fall in a significant way. Some thought this was true because it is a mid-term election year. Others thought that the Fed will do whatever it takes to avoid a recession…even though recessions are normal and healthy in a capitalistic society. Finally, others felt that inflation would not just ease from the extreme levels reached by early summer, but that those levels would magically fall out of bed by the autumn months.
We have stated many times in recent weeks (and for many months for that matter) that even though “peak inflation” has likely been reached, that it would plateau at a much higher level than anything we’ve seen in 40 years. Therefore, we won’t bore you by regurgitating our argument on this issue once again. (We’ll save that for future pieces. 😊)
However, we do need to point out that the Fed has been very good in telegraphing what they are going to do over the years. Yes, they DID have to change quickly in very late 2018…when the high yield market began to seize-up…but that was in response to an emergency. (It was a bigger problem than most people realize.) Maybe they do this again. Maybe the fixed income markets will freeze up and the Fed will have to do a “surprise pivot.” However, the odds that this will happen without another substantial down-leg in the stock market are low in our opinion.
Except for that one very quick change in policy, the Fed has pretty much done what they have told us there were going to do for a very long time now.
We can criticize them all we want for waiting so long to start fighting inflation by tightening their policy, but we weren’t fooled by their actions. They told us they were not going to start tightening last summer and fall…and they did not do it! Then, when they told us in late November and throughout December that hey were finally going to start tightening…and that is exactly what they started doing!......Therefore, we’re not so sure why so many people became so dovish about the Fed this summer. (Bear market rallies can cause people to think and act in a strange manner.)
We’ve heard a lot of “Fed speak” since the last Fed meeting. Almost all of it has been quite hawkish. In fact, we can easily say that most of it has been VERY hawkish. We’ll see if Mr. Powell confirms this extremely hawkish rhetoric at the Jackson Hole meeting later this week…..When Mr. Powell finally confirmed the hawkish rhetoric that most FOMC members had been using for a month or more back in late December…the markets finally started reacting. We wonder if the same thing will take place next week. (Actually, it looks like they’re already starting to react.)
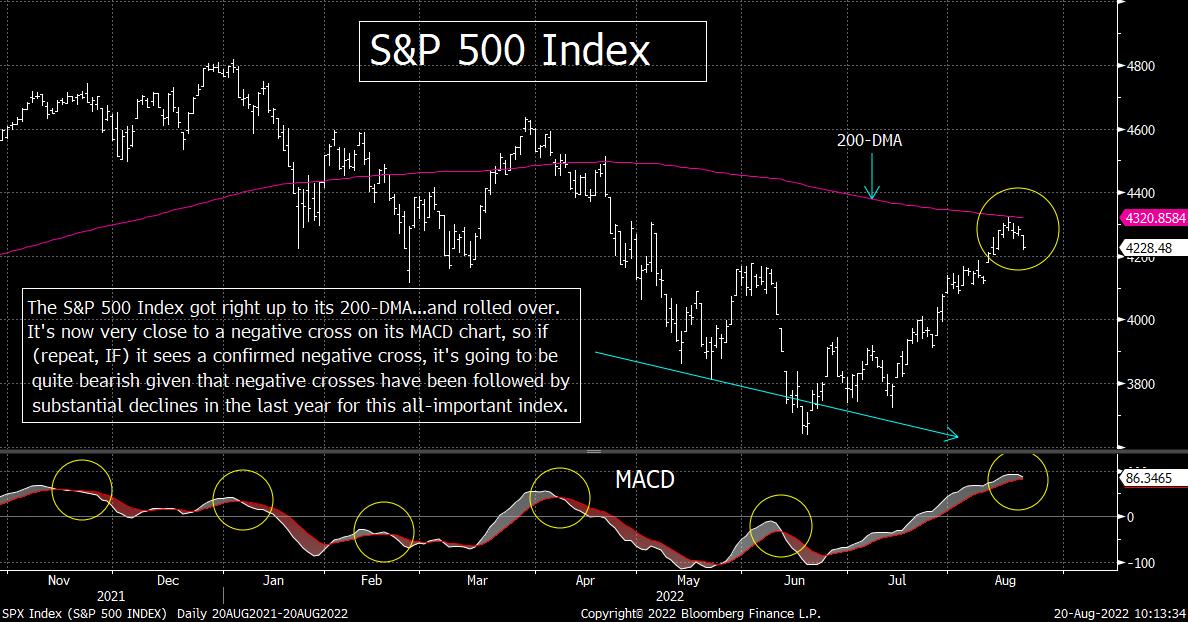
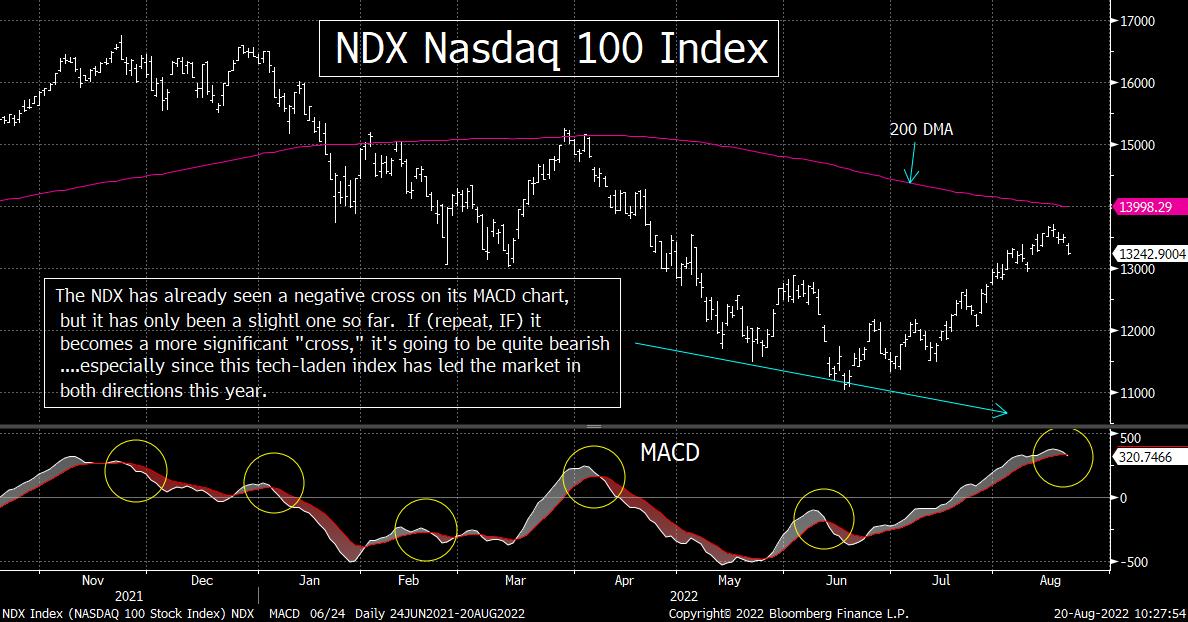
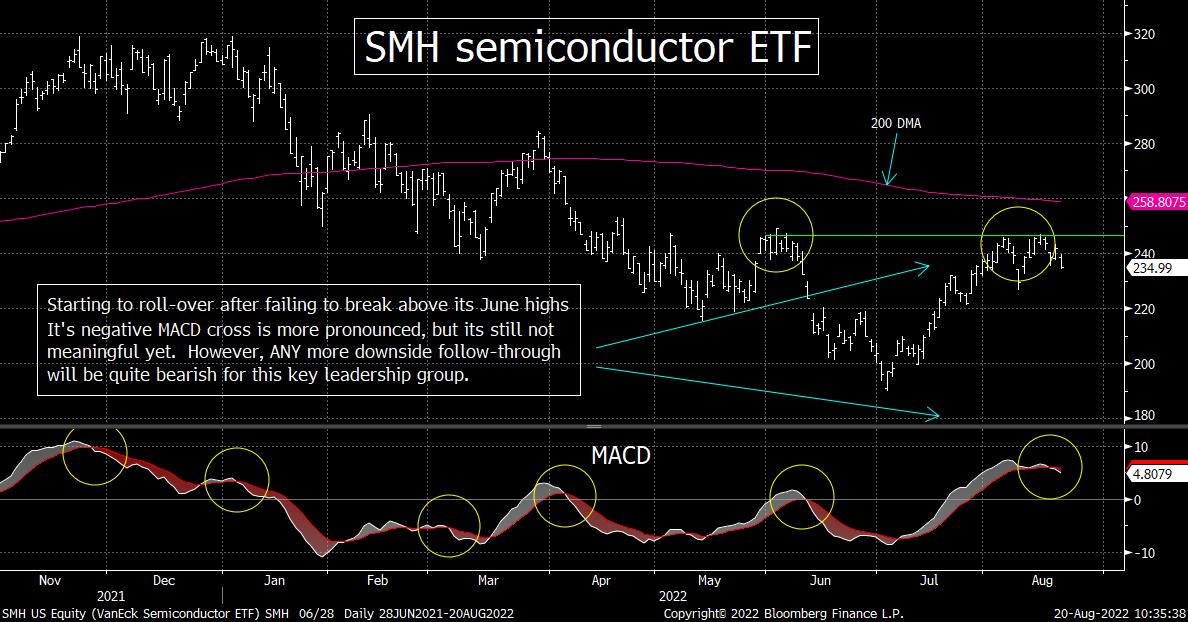
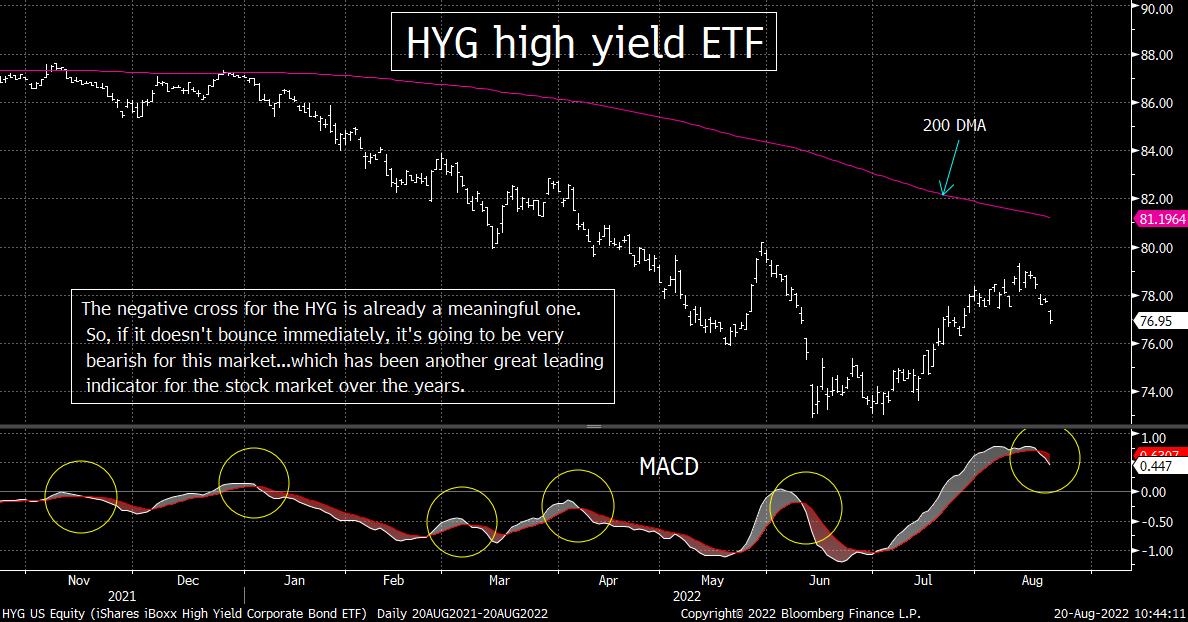
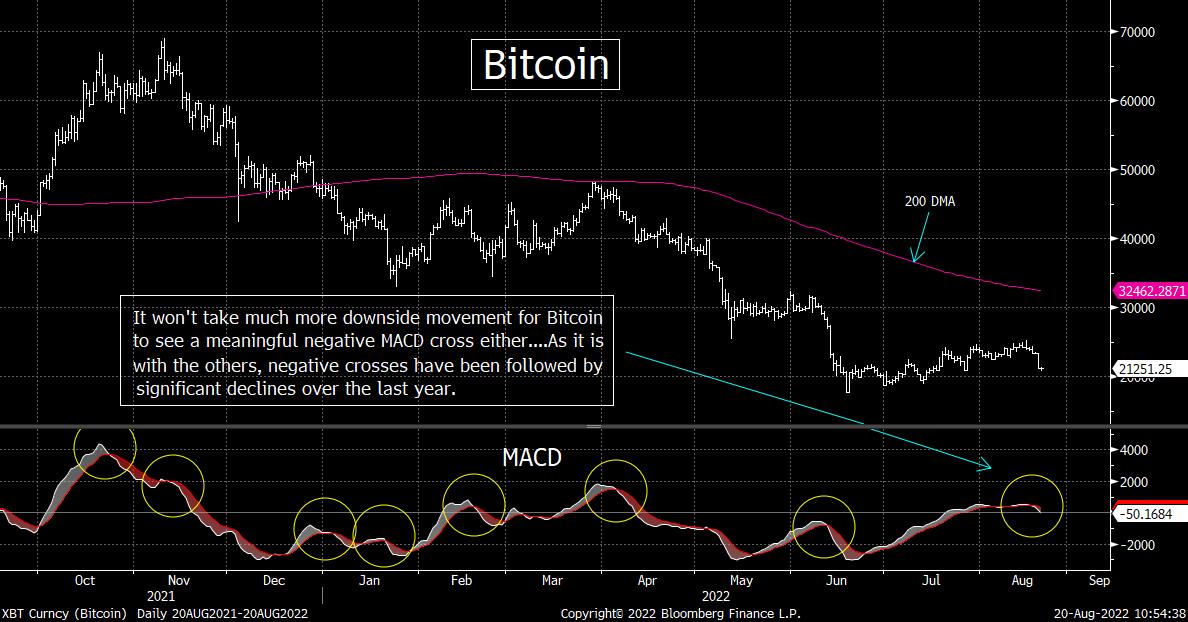
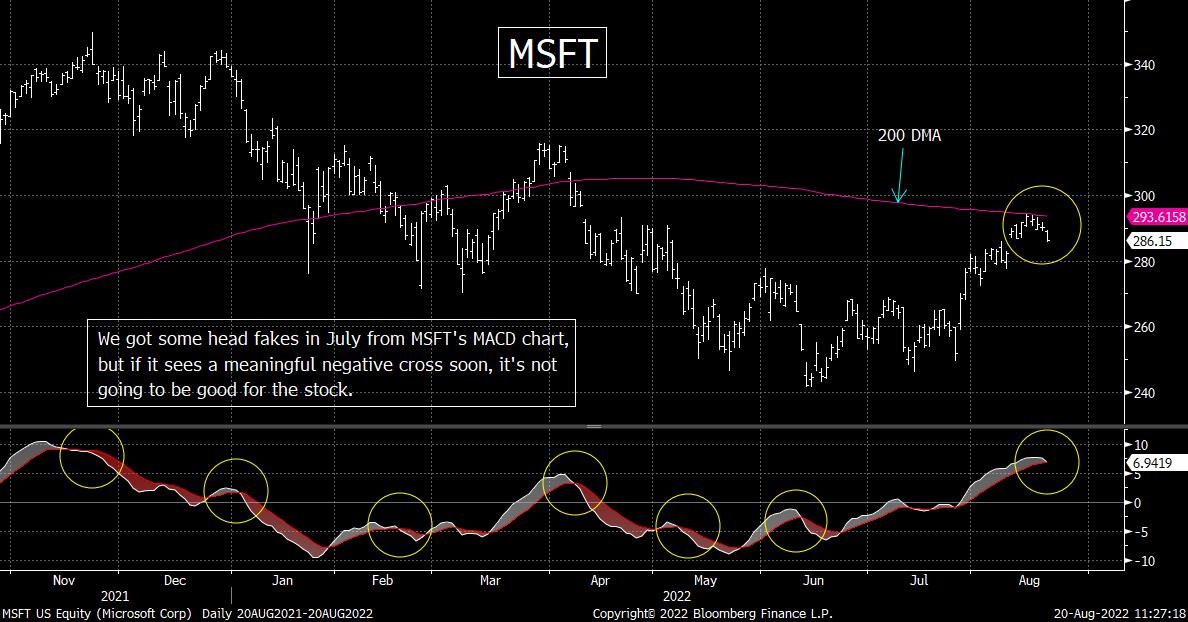
3) The stock market has acted extremely well for most of this summer. However, no market moves in a straight line. There is one possible development that could signal that the market is going to see another meaningful decline in the coming weeks. Several key indices, groups (ETFs), and individual stocks are seeing negative MACD crosses right now. Most of them are very mild, BUT if they become larger ones, it’s going to raise a big warning flag.
The MACD charts are something we look at very frequently. MACD stands for “Moving Average Convergence Divergence” and it is a very good indicator for confirming changes in trend. It does not tell us if a stock, a group or a market is overbought or oversold. It also does not tell us that an asset has reached a top or a bottom. Instead, it gives us signals that an asset has recently peaked or bottom…and that a new trend is emerging. (To a certain degree, when we see a positive or negative MACD cross, it is much like the “golden cross” and “death cross.” However, instead of using the 50 DMA and the 200 DMA, it uses shorter-term exponential moving averages.)
Like it is with any indicator in technical analysis, we always want to make sure that a “breach” is not a “head fake.” In other words, we always want to make sure that a move is more than just a slight one…because those kinds of “breaks” can indeed be just head fakes…and not the real thing. For example, when we talk about specific technical support or resistance levels, we want to see them broken to the upside (resistance) or downside (support) in a meaningful way. If it’s only a mild break, the risk of a head fake is still very real…..The same is true for MACD crosses. Sometimes a “cross” is a very mild one…and sometimes it’s so close to a cross that one can mistakenly assume that it’s going to take place. However, it is always important to make sure that the “cross” does indeed take place…and that it becomes a significant one.
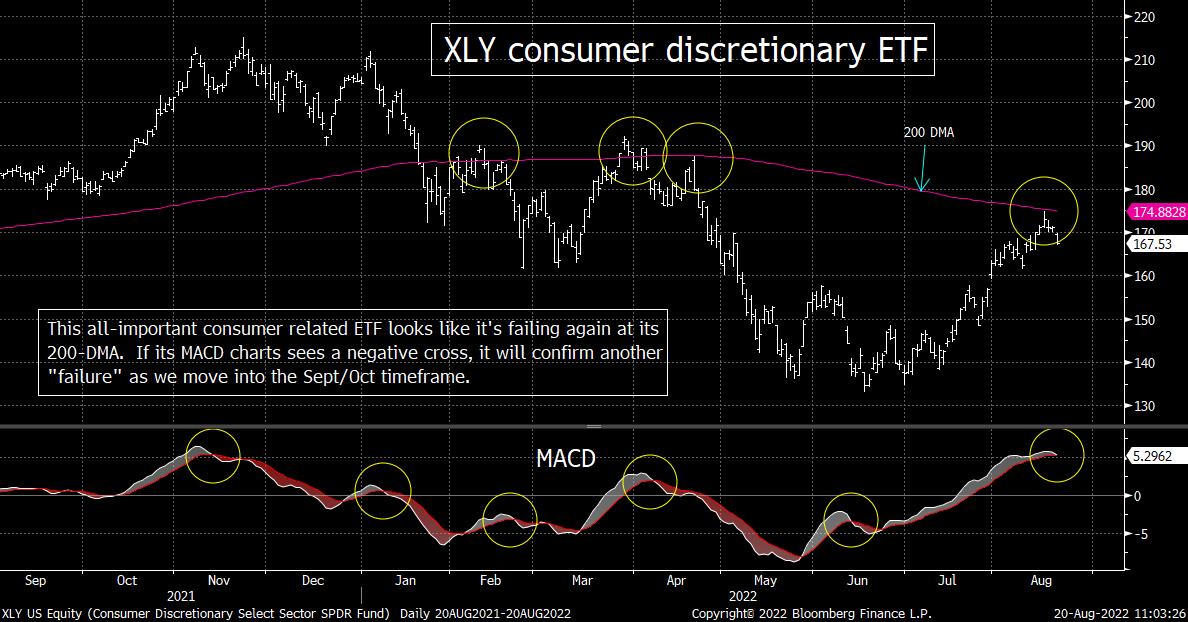
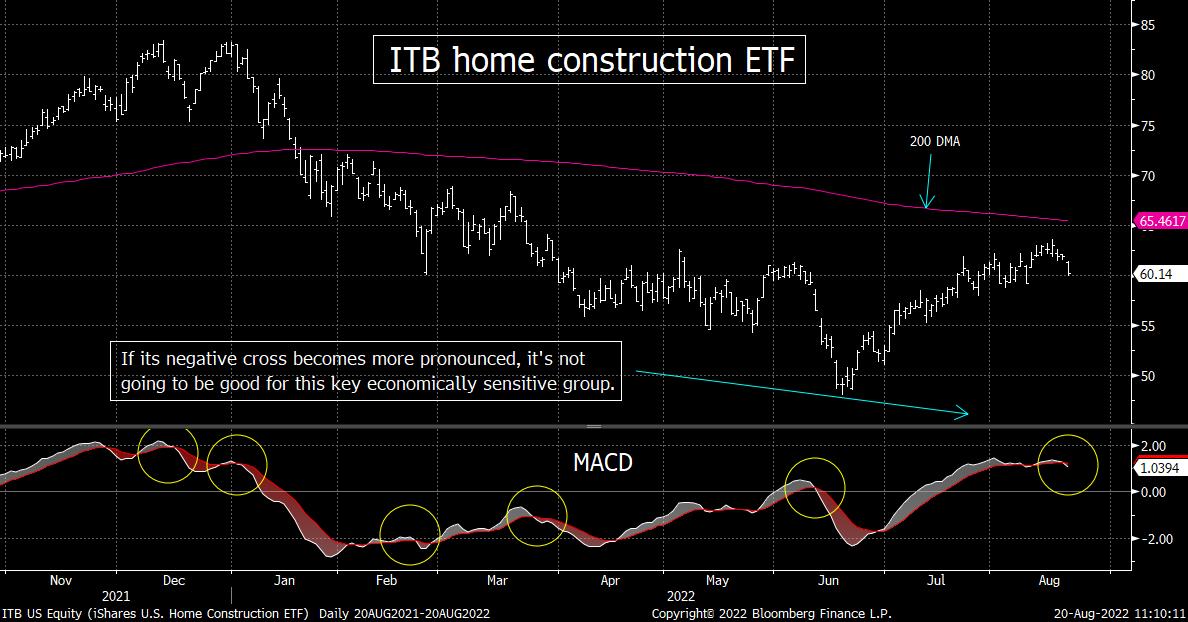
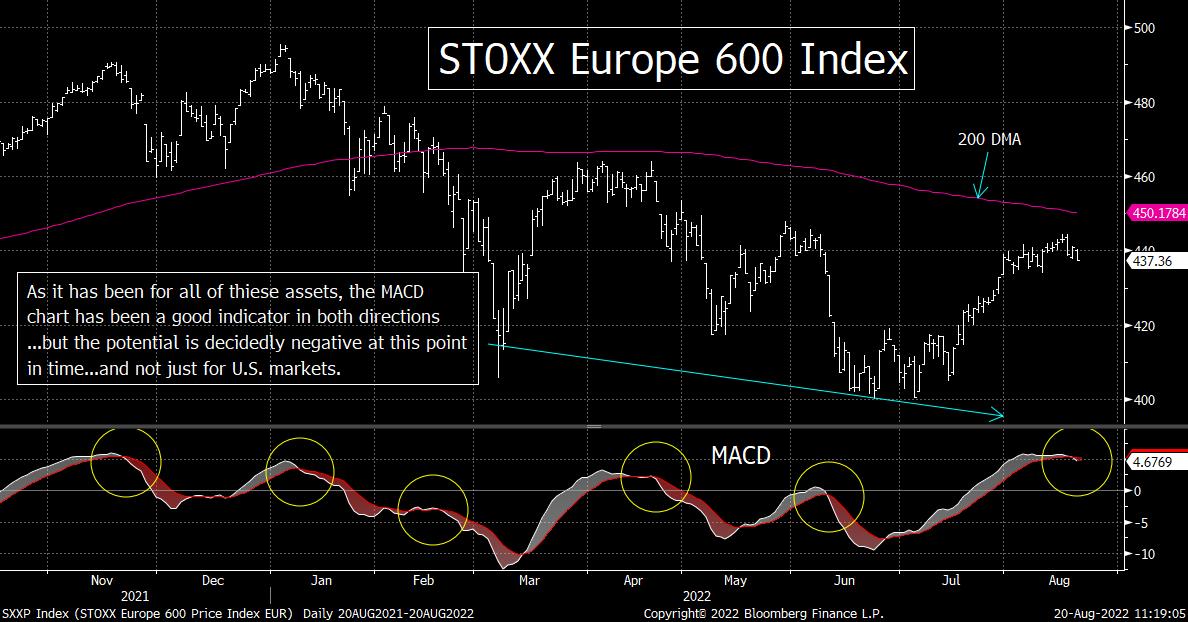
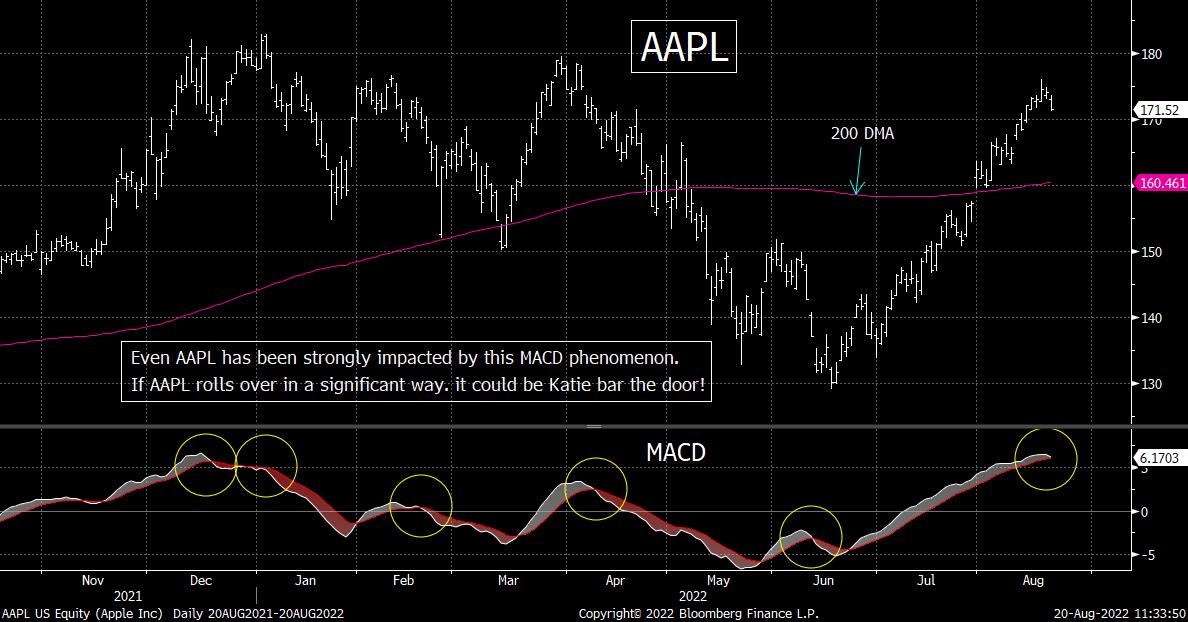
The reason we’re so focused on the MACD charts right now is that SO MANY of them are either very close to seeing negative crosses…or they have already developed a negative cross. (In that second situation, some of them have not become a meaningful one yet.) Therefore, even though the stock market has only seen some weakness over just the past few days…it could become a significant turning point for many important stocks…many important groups…and the stock market in general…if (repeat, IF) we see more downside movement in the next week or two.
This “downside follow-through” does not have to come Monday morning. It may not come for several days. However, if you look at the extensive number of MACD charts we have provided this weekend (below), you will see that any/all meaningful (confirmed) negative MACD crosses that we’ve seen over the past year or so have been followed by substantial declines. Therefore, if we see meaningful downside follow-through over the next week or two, it’s going to be a bearish development…just as we’re heading into the dreaded September/October timeframe.
They say a picture is worth a thousand words. This weekend, we’re providing 10 “pictures” to support our argument, so maybe it’s worth 10,000 words. No matter how you count it, it’s something to keep a very close eye on over the near-term.
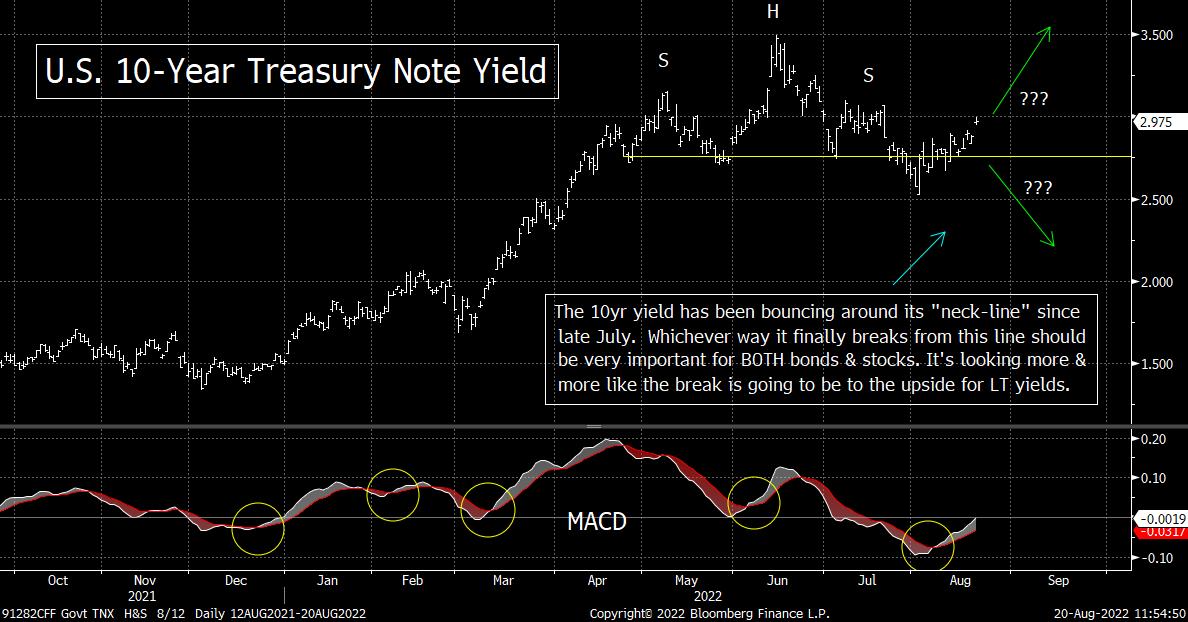
4) The yield on the 10-year Treasury note continued the rise last week…that begin in early August. It’s MACD chart has already seen a significant positive cross…and is getting very close to confirming a failed “H&S” pattern. This coming week’s Fed confab in Jackson Hole could give us the clarity we need on the direction of long-term interest rates over the coming months.
As we highlighted last weekend, a divergence had developed between the stock market and the bond market since the beginning of August. Despite some lower-than-expected inflation data two weeks ago, the yield on the 10yr note moved higher that week. This past week, it moved higher still…and closed within a whisker of 3% (at 2.97%). This finally took some air out of the sails of the stock market late last week, but as we highlighted above, we’re going to have to see more downside follow-through in the stock market to confirm a change in trend.
The same is true for the bond market. Yields have been rising for a longer period of time than the stock market has been falling (several weeks vs. several days), but those yields need to rise further to confirm that the trend towards higher long-term interest rates that we’ve seen for most of this year has re-established itself.
A lot of people will be looking at the 3% level as key resistance…because it is a round number. We agree that this will be a key psychological level, but the more important level on the technical side of things will be 3.1% in our opinion. The 3.08% level was the high in early July, so a break above 3.1% would mean that it has made a higher-high above those early July highs.
As we also mentioned last weekend, the U.S. 10yr yield had developed a “head & shoulders” pattern…and had moved back above the “neck-line” of that pattern (after a mild/quick dip below it) that week. Now…with the further rise in those long-term yields…its pulling even further away from that “neck-line.” Therefore, a move above 3.1% will not just give the 10yr yield a key “higher-high,” but it will also confirm that the “H&S” pattern has failed. There are few things that are more bullish in technical analysis that a “failed H&S” pattern. Therefore, a move above 3.1% should be quite bullish for long-term interest rates. (That, it turn, will be quite bearish for bond prices…and likely bearish for stock prices as well.)
With the big event in Jackson Hole this week sponsored by the Kansas City Fed, the next week or two should be extremely important for the bond market. The vast majority of FOMC members have been speaking in a very hawkish tone recently. (Some even saying that they’ll keep raising rates to tame inflation…even if it causes a recession.)….At the last press conference, Chairman Powell was a little more dovish than he had been in previous weeks, so if he changes…and comes out with the same high level of hawkishness that his colleagues have used recently…it could/should have a material impact on the markets.
The stock market has been ignoring “Fed speak” for many, many weeks now. If yields rise much higher, it won’t be able to do that anymore. It sure seems like the stock market started getting that message late last week…as yields pushed back towards 3%.
5) Summary of our current stance……Our view of that is going on in the marketplace has not changed much. We have been saying that we thought that this summer’s rally was a bear market rally…and that it would roll-over and make new lows once it had played itself out. We have based this on our belief that inflation will remain high…and thus the Fed will keep tightening (even if they throttle back on their rate hikes going forward). This, we have said, is not conducive to a situation where economic growth and earnings growth can improve much at all. Given that the stock market is expensive right now, this is not a recipe for the kind of further rally the bulls are looking for today.
Yes, the rally has been a strong one…and it could still go higher. However, after reaching a retracement of just over 50% of the 2022 bear market decline on the S&P 500 Index, the rally started to show some cracks last week. Again, maybe the market will bounce-back very quickly…just like it has so many times this summer. However, given that the bear markets of 2000-2003 and 2007-2009 BOTH saw retracements of just over 50%...only to roll-over in a dramatic way...and given the MACD charts on so many different assets right now…the chance that the market is in for some tough sledding have risen significantly.
We’re heading into the September/October timeframe once again…….Don’t fight the Fed…Don’t fight the Fed…DON’T FIGHT THE FED!
Matthew J. Maley
Chief Market Strategist
Miller Tabak + Co., LLC
Founder, The Maley Report
TheMaleyReport.com
275 Grove St. Suite 2-400
Newton, MA 02466
617-663-5381
mmaley@millertabak.com
Although the information contained in this report (not including disclosures contained herein) has been obtained from sources we believe to be reliable, the accuracy and completeness of such information and the opinions expressed herein cannot be guaranteed. This report is for informational purposes only and under no circumstances is it to be construed as an offer to sell, or a solicitation to buy, any security. Any recommendation contained in this report may not be appropriate for all investors. Trading options is not suitable for all investors and may involve risk of loss. Additional information is available upon request or by contacting us at Miller Tabak + Co., LLC, 200 Park Ave. Suite 1700, New York, NY 10166.
Recent free content from Matt Maley
-
 THE WEEKLY TOP 10
— 10/23/22
THE WEEKLY TOP 10
— 10/23/22
-
Morning Comment: Can the Treasury market actually give the stock market some relief soon?
— 10/21/22
-
What Do 2022 and 1987 Have in Common?
— 10/19/22
-
Morning Comment: Which is it? Is stimulus bullish or bearish for the stock market?
— 10/17/22
-
Morning Comment: Peak Inflation is Becoming a Process Instead of a Turning Point
— 10/13/22
No comments. Break the ice and be the first!
Error loading comments
Click here to retry
No comments found matching this filter
-
{[comment.author.username]} {[comment.author.username]} — Marketfy Staff — Maven — Member
Want to add a comment? Take me to the new comment box!

- 1 Campus Martius, Suite #200Detroit, MI 48226
- +1 877 440 9464