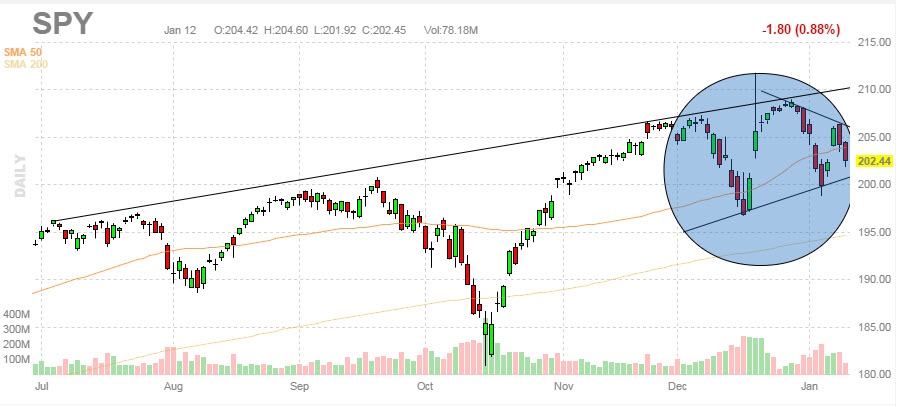
I want to take a look at where this market stands technically. As you'll see from the chart below, the S&P 500 is trading within a narrowing range near its all-time highs, and is possibly forming a bearish Head & Shoulders top (see shaded area). The upper trendline at the top of chart was last touched in late December, and there is a lower high forming here in January.
Of course, technical analysis only goes so far. The S&P 500 can just as easily breakout to the upside from here in investor enthusiasm regardless of what the chart says. But it does seem like a bearish bias is creeping into the way the index has been trading of late.
Fundamentally, we have a new earnings season approaching and no one is suggesting it is going to be a blowout. We are more likely to see mixed results as lower oil prices hurt some and help others. What is of most interest to me is how the banks report. The top 4 banks are all extremely leveraged in derivatives designed to hedge against interest rate fluctuations. If these huge bets (larger than 2007 which ultimately led to the market crash) do not begin to play out, we may see some pain in that sector.
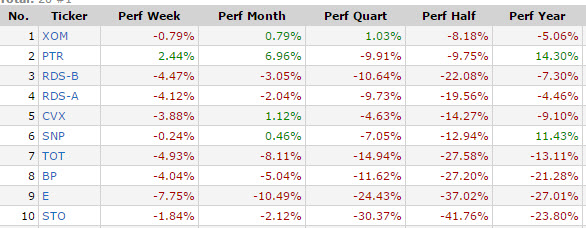
There are also debt-default concerns coming from Europe (again), Greece in particular (again), which the recent terror attacks and their aftermath are doing nothing to alleviate. And then there is oil: consumers may love lower oil prices (I sure do!) but keep in mind that the largest companies in the world, larger in market cap than 85% of all nations by GDP, are all oil companies. If they fall, so too do the economies of the US and Europe. And right now, they are falling. Just look at the price performance of the top 10 major integrated oil companies which together represent a market cap of nearly $2 trillion. They're awash in red:
So what is working? In my Options Letter we are in a bullish position on GDX and a bearish position on SPX, the latter of which is hedged by out of the money put-writes on SPY. Those are all working well. Yesterday we closed out a nice set of calls on AAPL, which also worked well. What's not working as well is our bullish bias on oil. We are still waiting for a bounce.
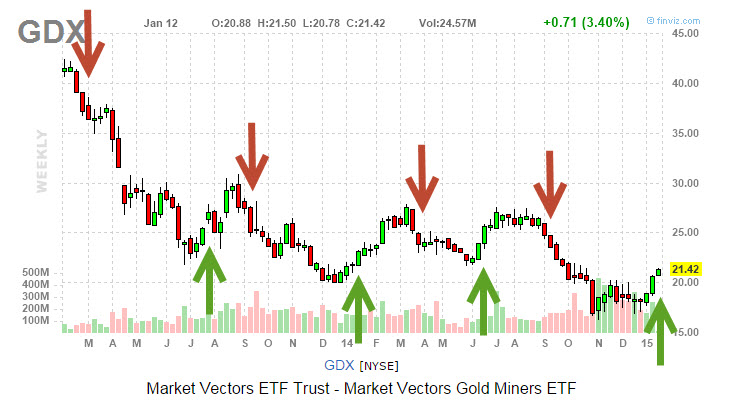
Speaking of the Gold Miners Index (GDX), each weekend I run a system I developed that gives me buy and sell signals on the weekly charts of 9 top ETF's, including GDX. Last night we got a fresh buy signal on the index, after closing out a nice short. Here is what our most recent signals look like:
Here is how we like to play these signals: we sell weekly or bi-monthly put-writes on GDX through the duration of the buy signal. Once we get a sell signal, we switch over to Bear Call Spreads, which we then hedge with far out of the month put-writes. it's a very profitable, and relatively safe, way to play this volatile index.
Blessings and happy trading to all, TC
Recent free content from Dr. Thomas Carr
-
{[comment.author.username]} {[comment.author.username]} — Marketfy Staff — Maven — Member


