

The Smelts of the SmallCaps System!
Quite often, in life as well as trading, the simplest things are the best things. The “Dogs of the Dow” is one of the simplest trading systems out there. The methodology is straightforward: buy the Dow Jones Industrial stocks with the highest dividends and lowest price; hold for one year; repeat. The theory is sound: low priced stocks with high dividends tend to be undervalued and therefore appreciate at a faster rate than average.
While the Dogs of the Dow have not performed well in recent years, the long-term returns are impressive. Consider the following stats for the “Dogs” strategy over the years 1973 to 1996:

This got me to thinking. What if we applied a similar strategy to smallcap stocks? What kind of returns could we get by buying the underperformers among, say, the S&P600 Smallcap Index? So I began tweaking a simple system. Let’s call it the “Smelts of the Smallcaps” system, with up-front apologies to our small, bony fish friends.

Here is what I learned:
Simply buying the 10 worst performers of the S&P600 and changing annually yielded a compounded return of +38.7% over a test period from 1/1/2000 to 5/1/2014, with a 4% reduction in drawdown relative to the S&P! This is roughly a 1,200% improvement over the S&P500 for the same period! This kind of alpha would turn a $10,000 investment into $972,847 in just over 14 years which is, of course, amazing:


But what if we add a valuation filter -- I prefer the price to sales ratio -- to ensure our stocks are undervalued? This simple tweak allows us to boost the compound annual return to 44.1%% over the same test period! Using this system with its “once-a-year”, 20 minute ritual the only work to be done, would turn a $10,000 initial investment into a whopping $1,665,479!


Finally, watch what happens when we add a growth metric -- the anticipation of future earnings growth -- to our scan. Here we are buying the worst 10 smallcap stocks based on price performance, after they have first been screened for low valuation,and for strong anticipated growth in earnings as measured by forward-looking EPS estimates. The results: a boost up to nearly 48% annual return, turning our $10k investment into a “quit-your-job” nestegg of $2,403,749!


Conclusion
CONTRARIANS UNITE! At least when it comes to smallcap stocks that are undervalued, showing signs of improving EPS growth, and which have had a lousy year on the performance side, it makes all kinds of sense to hold your nose and buy the “Smelts”. By the way, reducing the number of stocks from 10 down to 9, 8, and 7 increased the annual returns slightly but only at the expense of higher drawdown percentages. Reducing the rebalance period from annually to quarterly and monthly had no significant impact on gains. Considering the tax benefits of the annual hold, this is the preferred period.
Current “Smelts of the Smallcaps” stocks
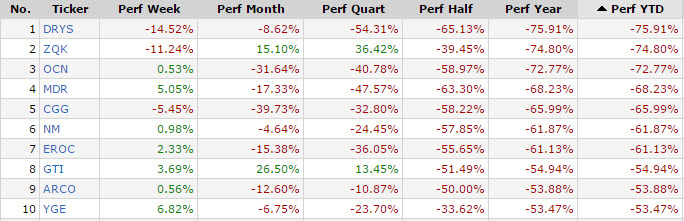
So what are the current “bottom 10? of the S&P600 that also match our other two criteria for value and growth? Here is the current list (as of 5/28/2014), a nicely diversified portfolio of stinkers -- "smelts" -- with nary a momentum stock among them. Buy on Friday, January 1st, hold for a year, then repeat. It’s that simple.
Recent free content from Dr. Thomas Carr
-
{[comment.author.username]} {[comment.author.username]} — Marketfy Staff — Maven — Member


- 1 Campus Martius, Suite #200Detroit, MI 48226
- +1 877 440 9464