

The Weekly Top 10...Any Upcoming Rate Cuts Will Be Determined by the Data and the Markets, NOT the Calendar...June 16, 2019 - BTFNow
THE WEEKLY TOP 10
Table of Contents:
1) If the Fed remains “market dependent”, they won’t cut rates until the market experience more stress.
2) There’s no question that the recent bounce has NOT been fueled by improving fundamentals.
2a) Just look at the Treasury market for confirmation of this.
3) Is it at all possible that the Fed wants to help the President’s negotiating stance with China?
4) More negative news (and bearish action) from a key leadership group (the semis).
5) Other groups/indexes that tend to lead are not acting well either.
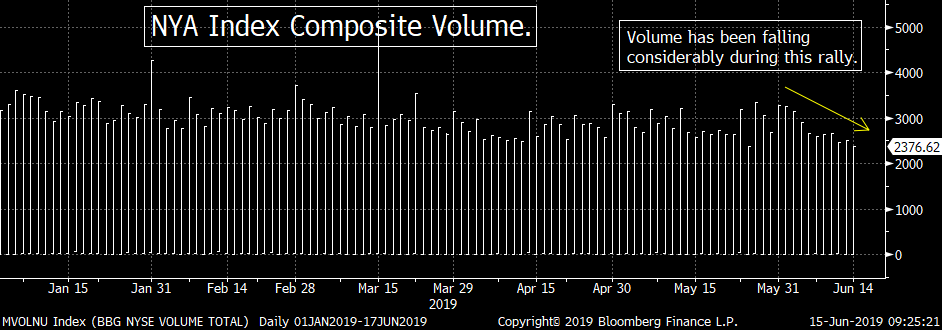
5a) Volume fell out of bed last week…not what you want to see in a rally.
6) If the Fed buys “insurance”, a meaningful break of 2940 on the S&P would be very bullish.
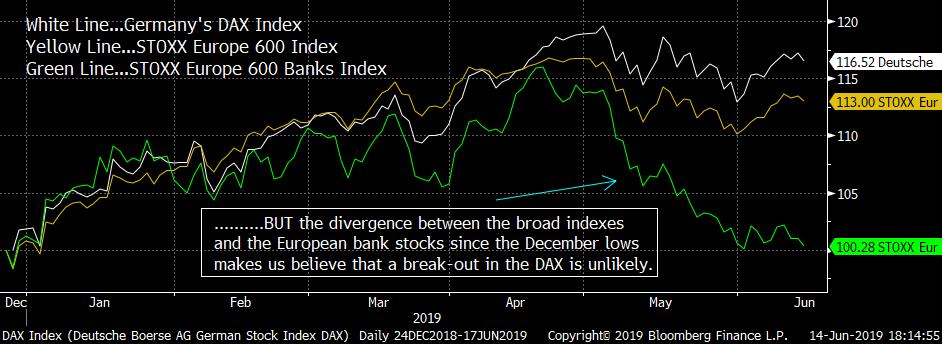
6a) Believe it or not, Germany’s DAX has some potential (even though we’re skeptical).
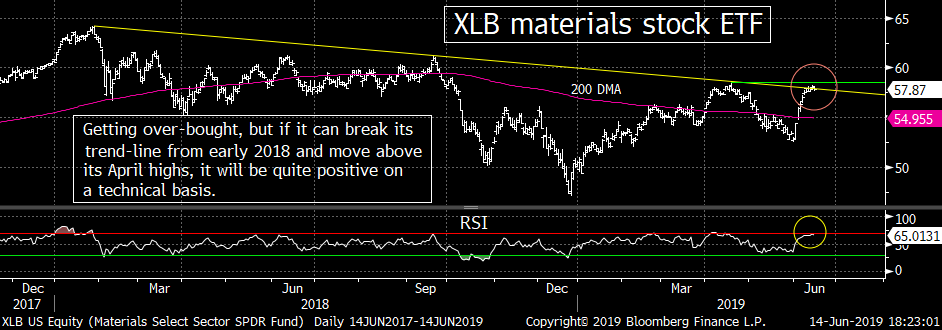
7) The XLB is trying to break-out. Time for out-performance in this group?
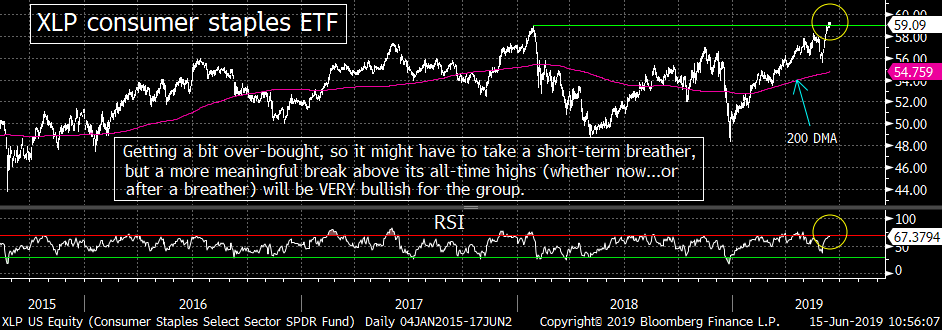
8) A break above its “double-top” high of $58 will be very bullish for the XLP consumer staples ETF.
9) I'm becoming more cautious on the energy stocks (despite WTI’s late-week pop).
9a) Keep an eye on XOM for clues on this group.
9b) Higher oil prices are sometimes bearish for stocks!
10) An update on the gold chart.
11) Summary of my current stance.
Short Version:
1) After a sharp rally the previous week, the stock market held-up nicely last week. However, this was not based on anything fundamental…because most of the fundamental developments were negative…as much of the economic data was weaker last week & full year earnings estimates came down. Instead, it was the expectation that the Fed will make an “insurance” rate cut…BEFORE we see more weakness in either the economy or the markets. The problem with this is that the history of the past 10 years (when the Fed’s accommodation has become essential for a rising stock market) shows that the Fed does not actually “act” unless or until the markets see a lot more stress than they’ve seen so far this time around
2) One thing is for sure, the markets recent rally has little/nothing to due with any fundamental improvement. The trade negotiations with China have not improved…the tension with Iran has grown…earnings estimates have fallen…and the bond market is signaling a weaker economy going forward. Therefore, I believe the initial bounce was fueled by an oversold market…and it has held-up due to the expectations that the “Fed put” is very much “in-the-money” right now…NOT due to any improving fundamentals.
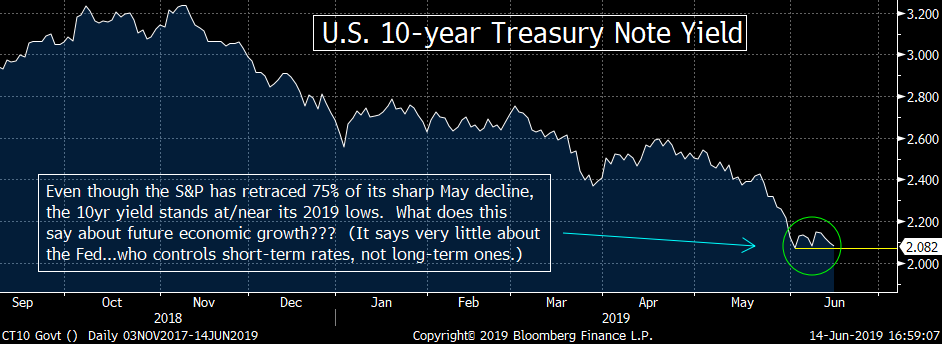
2a) Speaking of the move in the Treasury market, there is NO QUESTION that the bond market is pricing-in the kind of weaker economy that the stock market has not done yet. In fact, it’s not even close. With the S&P 500 standing just 2.0% below its all-time highs…and with a P/E ratio at almost 19x earnings…the stock market is not pricing-in weaker growth at all. This compares to the yield on the U.S. Treasury 10-year note has fallen back down near its late May/early June lows of 2.07% (closing at 2.08% on Friday). So the bulls had better be praying for a VERY dovish Fed next week. (Charts attached below in the “Long Version”.)
3) Having said all this, I do not mean to imply that there is zero chance that the Fed will cut before we see any more stress in the economy or the markets. The Fed is not suppose to be political, but everybody knows that they can be from time to time. Today, politicians & business leaders from both sides of the aisle want China to change their practices. So if the Fed wants to help, they’ll do what they can to keep the economy & the markets elevated…which will strengthen the President’s negotiating stance..……This is not a scenario (conspiracy theory) I would agree with, but it’s also not a scenario that is as outrageous as it might sound at first. Therefore, we’re going to have to stay nimble next week.
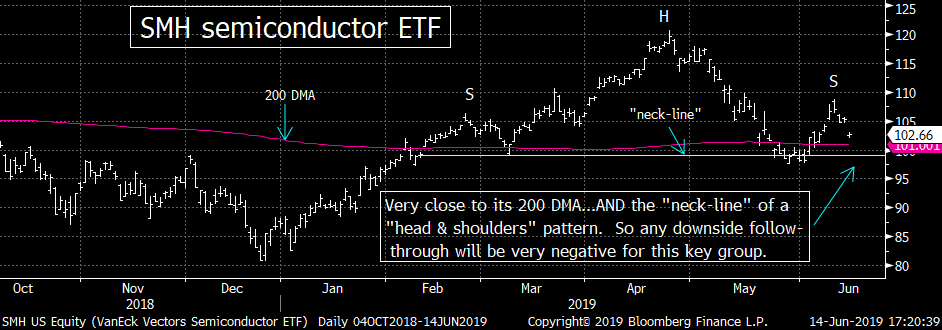
4) The semiconductor stocks continue to be a very important leadership group. They topped out months before the market did last year…and they led the way higher over the first 4 months of this year with their 50% rally. However, they are under-performing once again…and the fundamentals supporting the group are deteriorating (and were already deteriorating even before the trade talks with China broke down). Also, any further weakness in the SMH will be quite negative on a technical basis. (Chart below in the “Long Version”.)
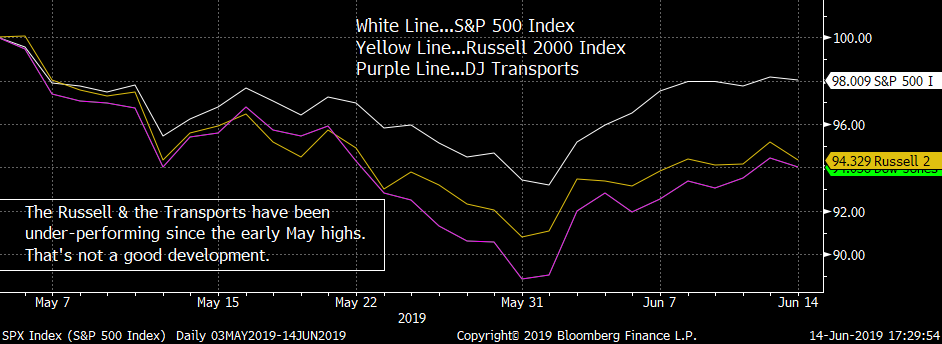
5) The same can be said about the technical picture surrounding two other key leadership groups/indexes…the Russell 2000 and the Transportation stocks. They’ve both retraced a smaller amount of their May declines. Therefore, on top of the under-performance of the semis, we have two other key leadership groups/indexes that have been under-performing…and thus the bond market is not the only thing that is painting a different picture than the big three stock indexes have been painting over the past two weeks. This is definitely a big yellow flag for the broad stock market IMHO. (Chart below.)
5a) Another development that worries us is the big drop in volume we’ve seen over the past two weeks or so (especially last week). We DID see some decent volume on the first few days…as a lot of shorts got covered. However, volume slipped lower shortly after that…and fell out of bed last week. This tells us that we’ve haven’t seen any “real buying” yet…which is usually what we see after the initial pop if the market is going to continue to rally over the intermediate-term. (Chart below)
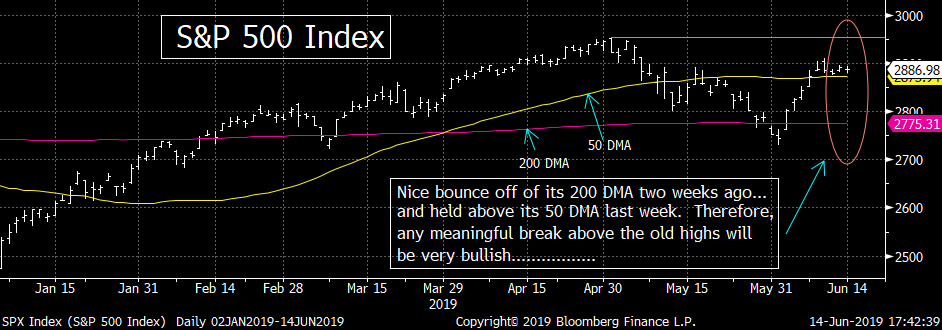
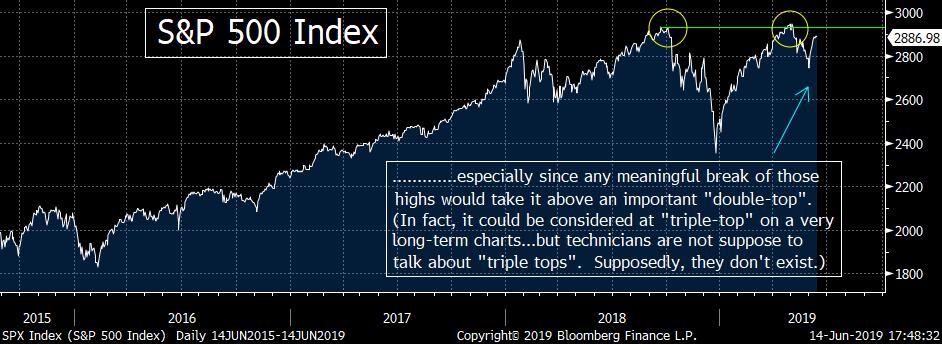
6) Going back to point #3…since it’s not out of the question that the Fed could indeed signal that they’re almost certainly going to cut rates in July at next week’s meeting, let’s look at the technical picture of the S&P 500 index through a bullish lens. (I always like to offer bullet points from both sides of the bull/bear ledger). If the Fed signals that they’re going to keep the market from seeing even a normal & healthy correction…and the S&P rallies about its “double-top” highs of 2940 in any significant way…it’s going to be VERY bullish for the market on a technical basis. (Charts below.)
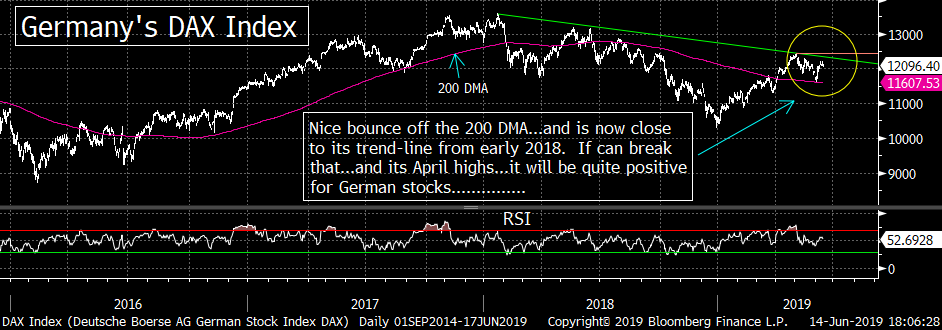
6a) Staying on the bullish side of the ledger, the chart on Germany’s DAX index actually has some potential. It’s recent rally has taken it up to its trend-line from early 2018. So if it can break that line…and follow it up with a “higher-high” (above its April highs)…it will be quite positive on technical basis. THAT SAID, given the action in the European banks…and the -0.25% yield on the Germany bund…we’re do NOT think the DAX will break out. However, the fundamentals pointed to a rally in Europe in 2018…and the exact opposite took place. So given the technical backdrop for the DAX right now, a break-out in the DAX is possible (even if it’s not probable). So I’ll be watching that index closely going forward. (Charts below)
7) The XLB materials stock ETF has lagged the S&P since the early 2018 highs, but its chart looks quite good right now. It’s getting a bit over-bought on a near-term basis, but if it can follow a recent “higher-low” with a “higher-high” (above its April highs of $58), it will be very positive for the group. With 1/3 of the XLB hitting new 52 week highs over the past week, the group has some nice momentum. So it could even out-perform…even if the broader stock market rolls over. (Chart below)
8) The defensive XLP consumer staples ETF also looks quite good. It is also over-bought on a near-term basis, but if it can break meaningfully above its “double-top” high of $59 (either now…or after a “breather”), it’s going to be very positive for this sector. The XLP has even better momentum than the XLB…as HALF of the XLP has hit new 52 week highs in the last week or so. Therefore, with all of the uncertainties facing the markets right now, this key defensive group should continue to be a good play. (Chart below)
9) A very small number of names in the XLE energy ETF (two names in particular) are disguising a period of very poor performance in most of the rest of the sector. In fact, the OIH oil service ETF closed right on its December lows last week! Therefore, if the geopolitical issues calm down…and we see any further decline in WTI…it’s not going to be good at all for the energy equities. Therefore, I'm definitely becoming much more cautious on the energy stocks right here. (Charts below)
9a) I’ll be watching XOM in particular. If it rolls over in a material way, it could/should lead to more selling in the entire group (given how much influence the algos have on the ETF’s in today’s market). (Charts below)
9b) BTW, if crude does rise further…due to the tensions in the Gulf with Iran…it will NOT be good for stocks. Yes, they are usually highly correlated, but when oil rises due to a fall in supply…rather than a rise in demand…it is bearish for stocks. In other words, when oil rises when demand is strong, it’s a SIGN of a strengthening economy. However, when it rises due to supply constraints, it CAUSES economic growth to weaken.
10) Let’s update the chart on gold. It is now testing its first resistance level (its Feb highs of $1,340), so a meaningful close above that level will be positive. However, I still believe it needs to break above the sideways range it has been in for several years now (above $1,380). Although gold has already broken above its trend-line going all the way back to 2011, it’s still going to need to breakout of its sideways range to confirm a change in trend. The potential is certainly there, but we still need more upside follow-through. (Chart below.)
11) Summary of my current stance…..There’s no question that “fighting the Fed” is a very dangerous tactic to take…but I'm not so sure that the Fed’s language recently means they will definitely cut rates without more signs of tension in the economy/markets. I believe the history of the past 10 years tells us that the Fed is quite “market dependent” and thus they will not actually cut rates (no matter how much they talk about it) until we see a lot more stress in the economy AND in the markets. THEREFORE, ANY UPCOMING RATE CUTS WILL BE DETERMINED BY THE DATA AND THE MARKETS, NOT BY THE CALENDAR! …With this in mind, I continue to believe that investors should raise cash on rallies…so that they can take advantage of a deeper correction later this summer/fall. If investors want to buy on weakness, they should look at the consumer staples…which look AT LOT better on the charts than the groups that have traditionally led rallies in the past (the semis, small caps and transports).
Long Version:
1) I’d like to begin this weekend with my belief that the stock market is only holding up near its all-time highs because investors believe that the “Fed put” is very much “in the money” and that they are going to make an “insurance” rate cut to help the economy from weakening further and keep the stock market rallying. I'll discuss why I believe investors have come to this conclusion in point #2, but I think it’s more important to first reiterate why I think the Fed will NOT employ a rate cut unless or until the economy weakens further AND the stock market sees a deeper decline than it saw in May….First and foremost, the history of the past 10 years tells us that the Fed has become VERY “market dependent” when it comes to the timing of their shifts towards actually enacting simulative programs. They did not engage in QE’s 1, 2, 3…or Operation Twist…or even their decision to delay further rate hikes after their initial one in late 2015…until the stock market had fallen well into the double digits (in terms of a percentage move). This year, the S&P had not even fallen 7% at its worst level...and stands only 2% below its all-time highs right now!!!! So if they follow the script they’ve been following for the past decade (ever since their moves have become so “market dependent”…and ever since their accommodation has become such an important part of any U.S. stock market rally), we’re going to have to see the markets fall a lot further before they actually implement their rate cuts……Let’s face it, even those who have had their heads in the sand over the past decade…and think the Fed is totally “data dependent”….would have to admit that although the economy is weakening, it’s level of growth is not any worse than it has been in several instances during this expansion…and those examples were not followed by recession…….Of course, there are those who believe the Fed will do an “insurance” rate cut…much like they did in 1995. The problem with this thinking is that it does not take into consideration that the level of leverage in the system is MUCH higher than it was in 1995. An “insurance” rate cut…that takes place before we see more stress in the economy and the market place…would create a situation where investors would not have to worry about ANY kind of market decline…so they’d add EVEN MORE leverage to their investments. That, in turn, would create the kind of bubble that I believe the Fed does not want to foster. In fact, it would be irresponsible if they did IMHO. Therefore, I don’t believe they will engage in an “insurance” rate cut before we see more stress in the markets………The old saying on Wall Street is, “Don’t fight the Fed”. If we find out next week that the Fed is not necessarily going to definitely cut rates in July, “fighting the Fed” will involve owning too many stocks up near these historic/expensive levels, not selling them. What I'm trying to say is: THE UPCOMING RATE CUTS WILL BE DETERMINED BY THE DATA AND THE MARKETS, NOT BY THE CALENDAR!
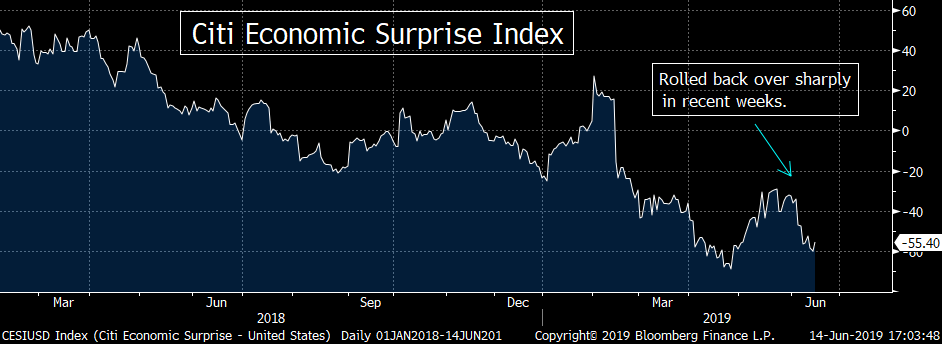
2) So why do I think it’s so obvious that the expectation of an insurance rate cut is the only reason why the stock market is holding so close to its all-time highs? Well, there are several reasons. First, the trade issue with China has not improved at all in the last week or two. If anything, the tension has only grown…with the Administration’s ultimatums towards President Xi for the upcoming G20 summit……The same is true when it comes to fundamental growth. As we have been expecting, full year earnings growth has been coming down…with more pundits following Morgan Stanley and JP Morgan’s leads by cutting 2019 S&P 500 earnings estimates this week. Similarly, we’ve seen weaker-than-expected domestic economic data (as can be seen by the rolling back over of the Citi Economic Surprise Index this month). The data from around the globe hasn’t been any better…highlighted by last night’s weaker-than-expected Industrial Production data out of China……These are not the kind of developments that would inspire a fundamentally motivated rally. (These developments are not weak enough to create rate cuts, but they certainly not the kind that would fuel a fundamentally-based sharp rally.) Therefore, it is my opinion that the rally we saw in the first week in June (one that we called for) mostly took place because the market has become quite oversold on a short-term basis. Last week, the rally only held-up because of the belief that the Fed will not let the market see even a normal and healthy correction of 10%...and not due to any fundamental improvement. Of course, as I’ve been saying for the past two weeks, I do not agree with these expectations about the Fed…but I do think it’s the one that makes the most sense to explain why the stock market rallied…and why it has has not rolled back over (yet).
2a) One thing is for darn sure…the divergence between the stock market & the bond market have become even more pronounced. The yield on the U.S. Treasury 10-year note has fallen back down near its late May/early June lows of 2.07% (closing at 2.08% on Friday). Thus there is no question that the bond market is pricing-in the kind of weaker economy that the stock market has not done yet. In fact, it’s not even close. With the S&P 500 standing just 2.0% below its all-time highs…and with a P/E ratio at almost 19x earnings…the stock market is not pricing-in weaker growth at all. (The 19x multiple we just sighted uses “stated earnings”. The “forward P/E” is at about 17x…but given how estimates for the the “E” part of the forward P/E ratio keep declining…and could/should decline further going forward…it’s hard to use the forward P/E when trying to decide the correct valuation. Besides, 17x still isn’t cheap at all.)
3) Having said all this, I do not mean to imply that there is no chance that the Fed will cut rates “early”. As always, I like to mention issues on both sides of the bull/bear ledger…no matter which side of that ledger we happen to stand on at any given time. In fact, there is a reasonable argument to be made why the Fed just might want to support the President in his goal to rein-in China’s trade practices of the past few decades. I know, I know…the Fed is not supposed to consider politics in any of their actions…but anybody who thinks that they never do are kidding themselves. Let’s face it, leaders from both sides of the political spectrum…and from all sides of the business spectrum…agree that something needs to be done about China. In fact, a recent poll of business leaders says they’re willing to take some pain…as long as we can actually force China to change their policies. Therefore, if the Fed wanted to help-out, they’d provide the kind of stimulus that would buoy the U.S. economy and the U.S. stock market…because a falling stock market and a weakening economy would weaken President Trump’s negotiating positions dramatically…….Of course, it’s probably a big reach to think that the Fed would engage in such a political conspiracy…as to help the President in this trade war, but it’s not out of the question. (Heck, the St. Louis Blues won the Stanley Cup and the Toronto Raptors won the NBA Championship…so ANYTHING is possible!!!)…..In all seriousness, however, we DO need to consider all possibilities…and thus investors will continue to NEED to stay nimble right now. I do not think the Fed will engage in a “pre-emptive” or “insurance” rate cut with the economy still far from recession, the stock market near all-time highs and the credit spreads seeing little stress. However, I DO think they will act earlier than the have in the past…but it will be after the stock market has fallen 10%-15% and credit spreads have widened out a lot more than they have so far. If we’re wrong…and the Fed IS going to add insurance very, very early in the process…we’ll know by this upcoming week. Therefore, to paraphrase the beer commercial, “Stay nimble my friends.”
4) On the technical side of things, one of our biggest concerns is that the groups & indexes that tend to be leading indicators for the stock market…continue to under-perform. This is particularly true for the semiconductor stocks. I'm sure you’re getting tired of hearing about this group, but there is no question that the chip market is an important indicator for global economic growth…and that the group has also been a great leading indicator for the broad stock market over the years…….As I’ve been saying for many weeks now, this group was already seeing weakness in demand, sales, pricing, etc…BEFORE the China trade negotiations broke down…and many domestic companies were already lowering 2019 earnings estimates! As we saw last week, this hasn’t change…as Broadcom (AVGO) lowered their full year guidance…sighting a “broad based slow down in demand.” AVGO declined 5.5% on Friday…which took it down very near to its 200 DMA (and not too far from its late May lows of $250). Therefore, any further downside follow-through will give AVGO an important “lower-high/lower-low” sequence…which would be quite negative on a technical basis…..More importantly, the weakness in AVGO took the SMH semiconductor ETF trading lower as well….and took it down very close to its 200 day moving average. That 200 DMA provided excellent support in both March and May, so if the SMH breaks below that line in a significant way going forward, it’s going to be quite negative for this very important leadership group. (It saw a slight” break below that line in late May, but not a significant one. It will take a significant break below the 200 DMA to confirm the break-down.)……As I highlighted mid-week last week, the SMH semiconductor ETF was already under-performing the broad stock market before that AVGO news hit the tape Thursday evening. It had only retraced 1/3 of its May decline…vs. a 75% retracement for the S&P 500. Since this group has been a GREAT leading indicator for the broad stock market (highlighted by the way it topped out several months before the S&P in 2018…and the way its 50% rally off the December lows led the market high over the first 4 months of the year)…any “lower-low” for the SMH would not just be a BIG red flag for the group, but it would also raise one for the entire stock market.
5) Speaking of groups/indexes that are leading indicators, the Russell 2000 and the Transportation stocks have been under-performing as well. Not only has the Russell 2000 under-performed on a relative basis…retracing about 40% of its May decline (vs. 75% for the SPX)…but it has under-performed on an absolute basis as well (rallying 4.8% from its June 3<sup>rd </sup>lows at its best level last week…vs. 5.4% for the S&P). The Russell is now testing its 200 DMA to the upside, so if it rolls back over at these levels…and takes out its recent lows (thus giving it a “lower-high/lower-low” sequence), it’s going to be very negative for this small cap index on a technical basis…….The situation is very similar for the DJ Transportation Index…which only retraced about 40% of its recent decline. However, more importantly, while the DJIA was coming within a half of a percent of its all-time highs in April, the Transports topped-out 4% below its own April highs. Therefore, if we see a “lower-high/lower-low” sequence in the Transports, it’s not going to be good for the Dow Theory followers either……In other words, on top of the under-performance of the semis, we have two other key leadership groups/indexes that have been under-performing…and thus the bond market is not the only thing that is painting a different picture than the big three stock indexes have been painting over the past two weeks. This is definitely a big yellow flag for the broad stock market IMHO.
5a) Ok, just because the these key leading indicators for the broad market are under-performing…does not mean that they’ll roll-over in a forceful way soon. However, the fact that things week’s average daily volume was 10% lower than ANY other week this year…tells us that the sharp bounce we experienced the previous week is losing some serious steam……It’s interesting to note that the last week was the lowest volume week since late August…just as the stock market was running out of gas last year. (The S&P only rallied another 0.57%...before it rolled over into its 20% deep correction.)…..In other words, after the initial short-covering bounce, investors have not participated in this rally. That should tell us that the odds that we’ll see much more upside follow-through are low.
6) Going back to point number 3…since it’s not out of the question that the Fed could indeed signal that they’re almost certainly going to cut rates in July at next week’s meeting, let’s look at the technical picture of the S&P 500 index through a bullish lens. (I always like to offer bullet points from both sides of the bull/bear ledger.) Let’s face it, even though some key leadership groups/indexes have been under-performing…and the volume has dropped-off substantially…the S&P holds up quite well and stands just 2% below its all-time highs!!!!! It was also able to hold above its 50 DMA all week last week. Therefore, if last week’s sideways move is followed by a further rally, there could be some considerable upside potential. In other words, if the Fed indicates that it will cut rates in July…no matter what happens to the economy or the market…and that leads to a meaningful break of the all-time highs…it’s going to be a VERY bullish development! (Don’t get me wrong, the Fed will never say they’re going to cut rates in July no matter what the data says…but if they IMPLY that they will, it will be VERY bullish.) Anyway, the April high of 2940 is essentially the same level the S&P topped out at back in September. Therefore, if the Fed indicates next week that it will keep the markets from going down even slightly…and that takes the S&P above “double-top” high in a significant way…it will be very bullish for the stock market…and we’ll have to prepare for another bubble. (God help us if that happens, but I wouldn’t want to stand in the market’s way if it does.)
6a) I’d also like to point out one bullish technical possibility for an area of the globe that has been getting a lot of negative economic news in recent months. That would be Europe…and more specifically Germany. The German DAX was able to bounce nicely off of its 200 DMA at the very beginning of the month…and like the S&P, it was able to hold above its 50 DMA last week. More importantly, the German DAX is now testing its trend-line that goes all the way back to its early 2018 highs. Therefore, if it can rally much further from here…especially if it can take-out its April highs, it’s doing to be quite positive for Germany’s stock market (and maybe indicate that things are not going to get much worse for this all-important European country)……Having said this, long-time readers know that one of my biggest concerns recently has been the atrocious action of the European bank stocks this year. They continue to flirt with its December lows (which are more than 33% below their early 2018 highs!). In other words, we are VERY concerned about the divergence that exists between the European broad stock market and the European bank stocks…and thus we think the DAX will fail to break-out here. (The fact that German bunds are yielding -0.25% doesn’t bode well for their economy/stock market either.) However, it is always useful to point out some potential technical developments…especially when the conflict with the consensus fundamental outlook. Those are the ones that can make the most money for investors…when the consensus gets caught on the wrong side of a trade. (Let’s face it, at the beginning of 2018, the overwhelming consensus was the European stocks were the place to be. We were in the vast minority in saying Europe was poised to under-performed based on our technical work. Sure enough, betting on Europe in early 2018 was one of the worst bets to place that year.)
7) The materials stock sector has lagged the S&P since the early 2018 highs…as the XLB material stocks ETF still stands almost 10% below those highs (vs. the S&P, which is unchanged vs its own early 2018 high). However, the chart on the XLB looks pretty good…and thus the group could play catch-up as we move through the summer. Actually, it’s RSI chart is a bit over-bought right now, so it might take a near-term “breather”. However, if it can bounce back and move above its current level any time soon (either now…or after a “breather”), it’s going to be VERY positive for the XLB. A meaningful move above the $58 level would follow-up its recent “higher-low”…with a nice “higher-high”…AND it would ALSO take it above its trend-line from the 2018 highs. So that kind of move would be doubly bullish on a technical basis…..I’d also note that a full 1/3 of the XLB has made 52 week highs in the last week, so the recent rally has been a pretty broad one for this ETF. Therefore, even though we’re still cautious about the broad stock market, the XLB could/should out-perform (and play catch-up) going forward. BUT, it will have to break above that key $58 resistance level in a compelling way before we can raise a green flag on the group.
8) However, since I am still quite cautious on the broad market, the consumer staples are still a defense group I continue to like (and like better than the material stocks). I do need to point out that the XLP consumer staples ETF, so this is another group that might have to take a “breather” to work-off that condition before it moves higher, but this is one that is testing an even more important resistance level than the XLB. First of all, I'd like to point out that the XLP has out-performed nicely ever since we urged investors to get more defensive back in late April. It now stands more than 2% higher than where it closed the month of April (vs. the S&P 500…which is down 2.3% since then). I’d also note that the XLP held up much better than the broad market throughout the month of May…as they did not fall more than 3% from their highs at any point during the month…while the broad market fell 7%-10%. (7% for the S&P and 10% for the Nasdaq.)…..On top of all this, the XLP made a new all-time high (and thus, by definition, a nice “higher-high”) last week….and HALF of the stocks in the XLP have made 52 week highs in the past week or so. So these are all positive developments for this key defensive group. Again, I have to highlight that the daily RSI chart on the XLP that has reached a level that has been followed by declines in recent years…and the same is true for several of the biggest names in this ETF (the names with the highest weightings). If you look at the top 7 names in the XLP (which make up 58.4% of this ETF), they are all giving us over-bought readings. Therefore, I wouldn’t be surprised if the XLP had to worked-off this over-bought condition before it broke more substantially above its early 2018 highs (and thus confirmed its break-out), but the charts for this group continue to look very bullish.
9) Crude oil saw a strong bounce late week last week…after another attack on oil tankers in the Gulf of Oman. However, even though WTI finished the week 3.6% above its Wednesday lows, it still ended the week with a decline. The same is true for the energy stocks…as the XLE energy stock ETF and the OIH oil service ETF ended the week with mild declines. As much as I worry that the tensions with Iran could lead to even higher oil prices near-term, I have become much more cautious on the energy stocks. They just do not act in a bullish manner at all. First of all, only small number of names are holding up the XLE. XOM and CVX make up over 42% of the XLE…and they stand 14% and 19% above their December lows…while COP, EOG, SLB, OXY, MPC & VLO
Recent free content from Matt Maley
-
 THE WEEKLY TOP 10
— 10/23/22
THE WEEKLY TOP 10
— 10/23/22
-
Morning Comment: Can the Treasury market actually give the stock market some relief soon?
— 10/21/22
-
What Do 2022 and 1987 Have in Common?
— 10/19/22
-
Morning Comment: Which is it? Is stimulus bullish or bearish for the stock market?
— 10/17/22
-
Morning Comment: Peak Inflation is Becoming a Process Instead of a Turning Point
— 10/13/22