

Enter the Cruelest Month
Geopolitics are back in focus on this first trading day of September. North Korea's push forward with another test on the nuclear front over the weekend caused U.S. Ambassador Nikki Haley to suggest that Kim Jong Un is "begging for war." And given that South Korea is saying that the North is prepping to launch an intercontinental ballistic missile, the situation appears to be heating up. In response, the U.S. is looking to hit Un's regime with even tougher sanctions via the U.N. In addition, it will be a busy week of "Fedspeak" with U.S. Federal Reserve officials Lael Brainard, Neel Kashkari, Robert Kaplan, and Bill Dudley (all voting members of the FOMC) slated to speak and the ECB meeting on Thursday. All of which is occurring as we enter what has historically been the weakest month of the calendar.
But before we get carried away with speculation of what might come next, let's turn our attention to our objective review the key market models and indicators and see where things stand. To review, the primary goal of this weekly exercise is to remove any subjective notions one might have in an effort to stay in line with what "is" happening in the markets. So, let's get started.
The State of the Trend
We start each week with a look at the "state of the trend." These indicators are designed to give us a feel for the overall health of the current short- and intermediate-term trend models.
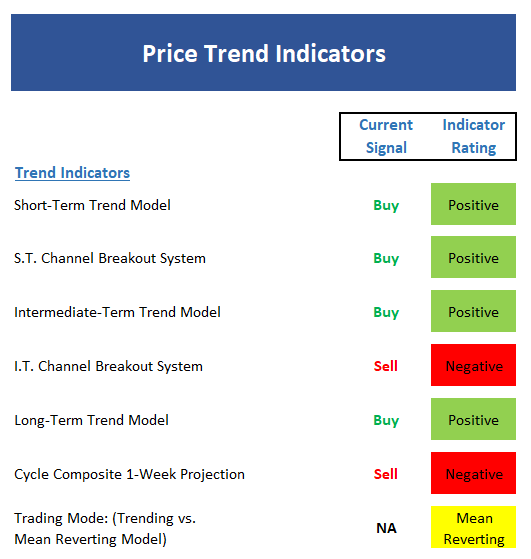
View Trend Indicator Board Online
Executive Summary:
- Not surprisingly, the short-term Trend Model has improved on the back of the recent rebound.
- The short-term Channel Breakout System remains on a buy signal. A break below 2428 would turn this indicator negative.
- The intermediate-term Trend Model flip-flopped back to green last week.
- The intermediate-term Channel Breakout System remains on a sell signal and will require a move over 2491 to turn green.
- The long-term Trend Model remains healthy.
- The Cycle Composite remains negative throughout September.
- The Trading Mode models are currently all in mean-reversion mode.
The State of Internal Momentum
Next up are the momentum indicators, which are designed to tell us whether there is any "oomph" behind the current trend...
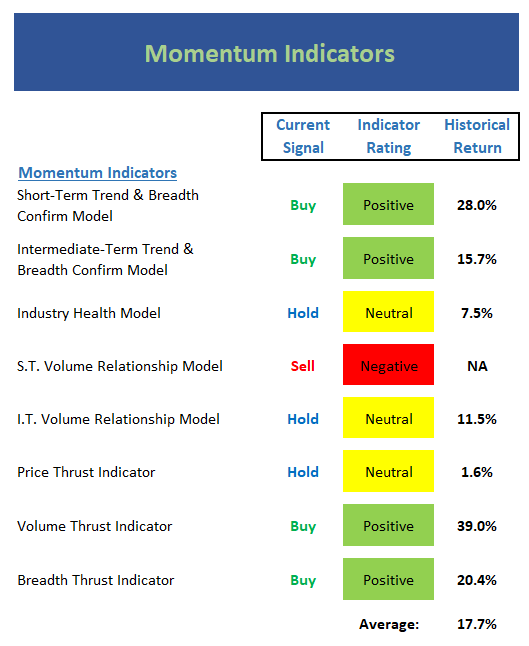
View Momentum Indicator Board Online
Executive Summary:
- The short-term Trend and Breadth Confirm Model flipped back to green last week.
- Ditto for intermediate-term Trend and Breadth Confirm Model.
- The Industry Health Model is still stuck in neutral.
- The short-term Volume Relationship upticked a bit last week. However, the overall reading remains negative and the up-volume line remains near the lows seen since 2014
- The intermediate-term Volume Relationship also improved a bit but demand volume remains in a downtrend.
- The Price Thrust Indicator managed to move up into the neutral zone - but not by much.
- The Volume Thrust Indicator moved up into the positive zone where historical returns are well above average.
- The Breadth Thrust Indicator also improved to positive last week. These are positive signs.
- Overall, while we can J20say that momentum is improving, it is by no means robust.
The State of the "Trade"
We also focus each week on the "early warning" board, which is designed to indicate when traders may start to "go the other way" -- for a trade.
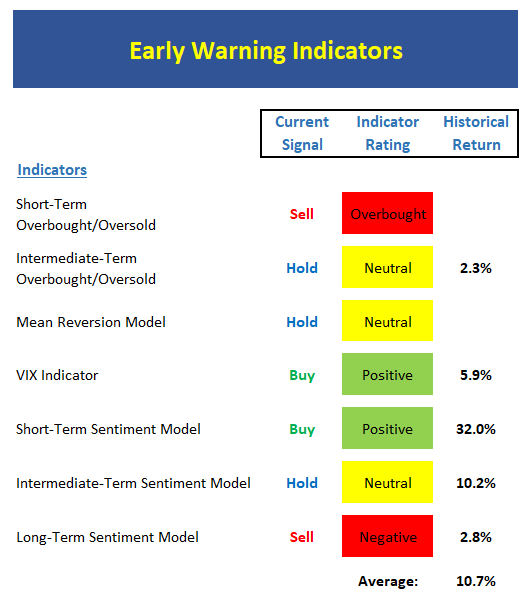
View Early Warning Indicator Board Online
Executive Summary:
- From a near-term perspective, stocks are now in overbought territory. As a reminder, this is NOT a sell signal, but rather an indication that the "easy" move has already occurred.
- From an intermediate-term view, stocks are neutral and not yet overbought. This suggests the bulls have some room to roam from a technical perspective.
- The Mean Reversion Model did its job by signaling a nice short-term buying opportunity recently. However the model is now back in the neutral zone.
- The VIX Indicator remains on a buy signal, but is now working toward a sell.
- From a short-term perspective, market sentiment is improving and still negative enough to be positive.
- The intermediate-term Sentiment Model remains neutral.
- Longer-term Sentiment readings haven't budged and remain negative.
The State of the Macro Picture
Now let's move on to the market's "external factors" - the indicators designed to tell us the state of the big-picture market drivers including monetary conditions, the economy, inflation, and valuations.
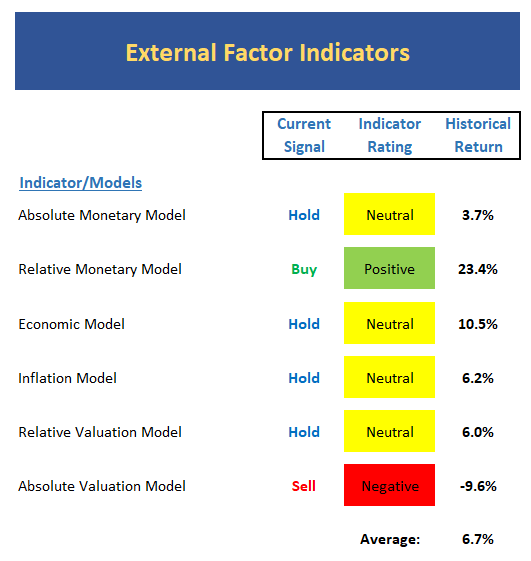
View External Factors Indicator Board Online
Executive Summary:
- Absolute Monetary conditions have weakened a bit recently and are neutral.
- The Relative Monetary Model continues to improve as rates hover near the lows of the year.
- Our Economic Model (designed to call the stock market) is weakening and now neutral. However, the model designed to call the economy still suggests strong growth ahead.
- The Inflation Model is now solidly neutral. This tells us the Fed may have trouble using inflation as cover to lift rates much farther.
- Our Relative Valuation Model continues to improve within the neutral zone and could turn bullish if rates move lower.
- The Absolute Valuation Model continues to be in overvalued territory.
The State of the Big-Picture Market Models
Finally, let's review our favorite big-picture market models, which are designed to tell us which team is in control of the prevailing major trend.
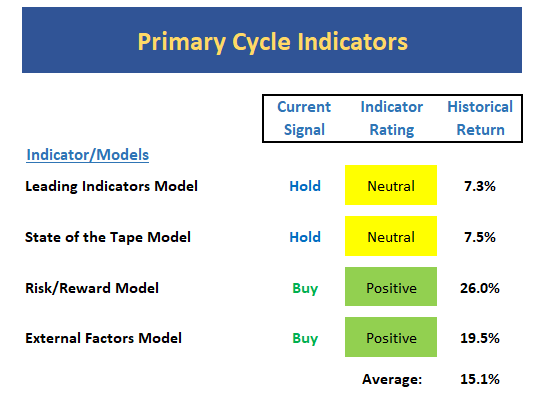
View My Favorite Market Models Online
Executive Summary:
- The Leading Indicators model, which was our best performing timing model during the last cycle, has weakened significantly and is only a stone's throw from flashing red. However, for now, the model is neutral.
- The Tape continues to muddle along in neutral/moderately positive mode.
- The Risk/Reward model remains modestly positive on the back of the recent move in rates.
- The External Factors model has also benefited from the move in rates and remains positive.
The Takeaway...
The keys this week are (a) the trend and momentum indicators have improved a bit but are nowhere near robust, (b), rates continue to be a tailwind for this market, (c) seasonality clearly favors the bears, (d) valuation levels suggest risk is high, (e) event risk remains, and (f) it's a bull market until proven otherwise.
Publishing Note: I am traveling with early commitments the rest of the week and will publish reports as my schedule permits.
Thought For The Day:
To be old & wise, you must first have been young & stupid. -Unknown
Current Market Drivers
We strive to identify the driving forces behind the market action on a daily basis. The thinking is that if we can both identify and understand why stocks are doing what they are doing on a short-term basis; we are not likely to be surprised/blind-sided by a big move. Listed below are what we believe to be the driving forces of the current market (Listed in order of importance).
1. The State of Geopolitics
2. The State of the Economic/Earnings Growth (Fast enough to justify valuations?)
3. The State of the Trump Administration
4. The State of Fed Policy
Wishing you green screens and all the best for a great day,

David D. Moenning
Chief Investment Officer
Sowell Management Services
Disclosure: At the time of publication, Mr. Moenning and/or Sowell Management Services held long positions in the following securities mentioned: none. Note that positions may change at any time.
Disclosures
The opinions and forecasts expressed herein are those of Mr. David Moenning and may not actually come to pass. Mr. Moenning's opinions and viewpoints regarding the future of the markets should not be construed as recommendations. The analysis and information in this report is for informational purposes only. No part of the material presented in this report is intended as an investment recommendation or investment advice. Neither the information nor any opinion expressed constitutes a solicitation to purchase or sell securities or any investment program.
Any investment decisions must in all cases be made by the reader or by his or her investment adviser. Do NOT ever purchase any security without doing sufficient research. There is no guarantee that the investment objectives outlined will actually come to pass. All opinions expressed herein are subject to change without notice. Neither the editor, employees, nor any of their affiliates shall have any liability for any loss sustained by anyone who has relied on the information provided.
The analysis provided is based on both technical and fundamental research and is provided "as is" without warranty of any kind, either expressed or implied. Although the information contained is derived from sources which are believed to be reliable, they cannot be guaranteed.
David D. Moenning is an investment adviser representative of Sowell Management Services, a registered investment advisor. For a complete description of investment risks, fees and services, review the firm brochure (ADV Part 2) which is available by contacting Sowell. Sowell is not registered as a broker-dealer.
Employees and affiliates of Sowell may at times have positions in the securities referred to and may make purchases or sales of these securities while publications are in circulation. Positions may change at any time.
Investments in equities carry an inherent element of risk including the potential for significant loss of principal. Past performance is not an indication of future results.
Advisory services are offered through Sowell Management Services.
Recent free content from FrontRange Trading Co.
-
 Is The Bull Argument Too Easy These Days?
— 8/31/20
Is The Bull Argument Too Easy These Days?
— 8/31/20
-
What Do The Cycles Say About 2020?
— 1/21/20
-
Modeling 2020 Expectations (Just For Fun)
— 1/13/20
-
Tips From Real-World Wendy Rhoades
— 5/06/19
-
The Best Recession Ever!
— 4/29/19
-
{[comment.author.username]} {[comment.author.username]} — Marketfy Staff — Maven — Member


- 1 Campus Martius, Suite #200Detroit, MI 48226
- +1 877 440 9464