One of the key issues in the stock market revolves around the idea of valuations. Cutting to the chase, the question is whether or not the growth rate of the economy and, in turn, earnings, is strong enough to justify what most see as lofty valuation levels in stocks.
One of the key lessons I've learned in my 30+ years of managing other people's money for a living is this: "Stock market valuations don't matter until they do. But then they matter a lot." So, the real question of the day is if valuations matter here.
The bulls argue that the combination of the current low level of interest rates, slow-but-steady economic growth, and the anticipated economic bump from tax reform means valuations are not a problem.
The bears counter with a host of rebuttals including the fact that traditional valuation metrics such as P/E, P/D, P/B, etc. are currently sky high and that even Janet Yellen and Stanley Fischer have publicly voiced their concerns about the valuation levels.
So, this morning I'd like to offer up a host of valuation charts, so that you can form your own opinion on the matter.
Let's start with the Price-to-Earnings ratios. Below are three different versions of the venerable valuation metric. First up is the P/E using GAAP (Generally Accepted Accounting Principles) earnings. Given the degree of "financial engineering" that companies do - including the game of excluding so-called "one-time" expenses that tend to reoccur on a consistent basis - I deem the use of GAAP methods as the only "legit" way to look at the P/E ratio these days.
GAAP Price to Earnings Ratio
View Larger Image Online
My first takeaway from this chart is there appears to be two "eras" involved. I've illustrated this by drawing boxes around the distinctly different periods. As you can see, in the first "era" the GAAP P/E stayed in a range between 6.5 and 28. But then the world and the valuation range changed as the two bubbles occurred.
The bulls like to look at the last 20 years and say, "See, P/E's aren't as high as they were in 2000 or 2008." Thus, there is no need to worry, right?
However, looking back at history, there is really no way to justify the argument that stocks are not at least richly valued at this time from a GAAP P/E perspective.
Next is the "Median P/E Ratio," which looks at the median P/E of the stocks in the S&P 500. The idea is to get a look at the P/E of the stocks in the "middle" of the market.
Median Price to Earnings Ratio
View Larger Image Online
A similar message is seen here. Two eras of valuation levels with the current reading about in the middle of the range seen since the mid-1990's. However, when looking at the current level relative to everything since 1965, well, again, it is hard to argue that stocks aren't overvalued to some degree.
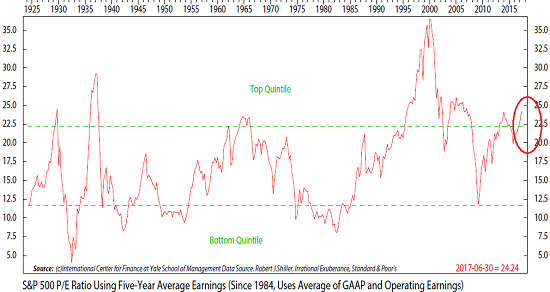
Finally, let's look at Yale's Robert Shilller's take on the P/E ratio. Professor Shiller takes a very long-term view of the issue by employing a rolling 5-year average of P/E ratios.
Shiller Price to Earnings Ratio
View Larger Image Online
The key here is the reading of this metric is currently in the top quintile of all readings since 1924.
Let's now move to other measures of market valuation. Here is the Price-to-Sales ratio going back to 1955.
Price to Sales Ratio
View Larger Image Online
Not sure if there is any additional explanation needed here.
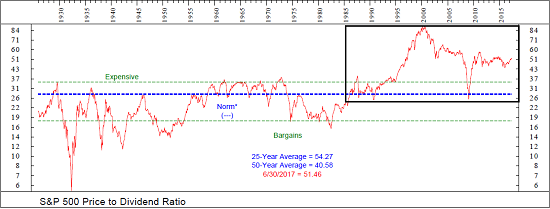
Here is the Price-to-Dividend Ratio going back to the early 1920's...
Price to Dividend Ratio
View Larger Image Online
Yes, it is true that companies have not focused on paying dividends in the last 10-20 years due to the taxation issue associated with dividends. Instead, CFO's found they could get more bang for their buck with stock buybacks. So, if you want to look only at the last 20 years, you can indeed argue that stocks are not overvalued here. But...
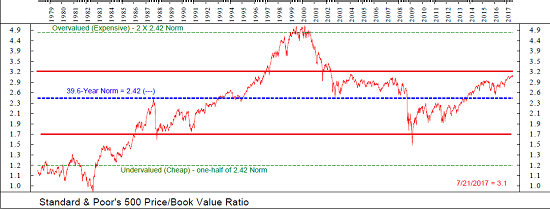
While there are any number of games to be played with earnings, the calculation of book value tends to be pretty straightforward. Below is the Price-to-Book Value ratio.
Price to Book Value
View Larger Image Online
My take is here is if one excludes the technology bubble period from 1997 - 2000, this valuation metric is at the high end of the historic range.
Next, let's look at Price-to-Cash Flow...
Price to Cash Flow
View Larger Image Online
Hmmm... I think the chart says it all here.
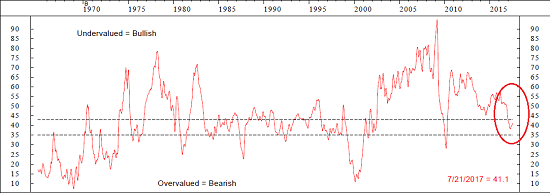
Finally, let's change things up and look at an NDR model that compares various valuation metrics relative to the level of interest rates.
Valuation Model - Relative to Interest Rates
View Larger Image Online
The first thing to note here is that this chart is "upside down" - i.e. overvalued is in the lower section of the chart and undervalued is the upper section. From my seat, the Central Bank Intervention Era is obvious on this chart as stocks were extremely undervalued relative to interest rates after the crisis and extending into 2013. However, since then, this valuation model has been trending lower. And while stocks are NOT overvalued using this approach, nor are the cheap.
In summary, I conclude that stocks are overvalued when viewed through a traditional valuation lens. As such, I have no choice but to conclude that risk factors are elevated. In short, when/if valuations "matter" due to some bearish catalyst, the mean reversion potential is worth noting.
Thought For The Day:
I am an optimist. It does not seem too much use being anything else. -Winston Churchill
Current Market Drivers
We strive to identify the driving forces behind the market action on a daily basis. The thinking is that if we can understand why stocks are doing what they are doing on a short-term basis; we are not likely to be surprised/blind-sided by a big move. Listed below are what we believe to be the driving forces of the current market (Listed in order of importance).
1. The State of the U.S. Economic Growth (Fast enough to justify valuations?)
2. The State of Earnings Growth
3. The State of Trump Administration Policies
4. The State of Fed Policy
Wishing you green screens and all the best for a great day,

David D. Moenning
Chief Investment Officer
Sowell Management Services
Disclosure: At the time of publication, Mr. Moenning and/or Sowell Management Services held long positions in the following securities mentioned: none. Note that positions may change at any time.
Disclosures
The opinions and forecasts expressed herein are those of Mr. David Moenning and may not actually come to pass. Mr. Moenning's opinions and viewpoints regarding the future of the markets should not be construed as recommendations. The analysis and information in this report is for informational purposes only. No part of the material presented in this report is intended as an investment recommendation or investment advice. Neither the information nor any opinion expressed constitutes a solicitation to purchase or sell securities or any investment program.
Any investment decisions must in all cases be made by the reader or by his or her investment adviser. Do NOT ever purchase any security without doing sufficient research. There is no guarantee that the investment objectives outlined will actually come to pass. All opinions expressed herein are subject to change without notice. Neither the editor, employees, nor any of their affiliates shall have any liability for any loss sustained by anyone who has relied on the information provided.
The analysis provided is based on both technical and fundamental research and is provided "as is" without warranty of any kind, either expressed or implied. Although the information contained is derived from sources which are believed to be reliable, they cannot be guaranteed.
David D. Moenning is an investment adviser representative of Sowell Management Services, a registered investment advisor. For a complete description of investment risks, fees and services, review the firm brochure (ADV Part 2) which is available by contacting Sowell. Sowell is not registered as a broker-dealer.
Employees and affiliates of Sowell may at times have positions in the securities referred to and may make purchases or sales of these securities while publications are in circulation. Positions may change at any time.
Investments in equities carry an inherent element of risk including the potential for significant loss of principal. Past performance is not an indication of future results.
Advisory services are offered through Sowell Management Services.
Recent free content from FrontRange Trading Co.
-
 Is The Bull Argument Too Easy These Days?
— 8/31/20
-
 What Do The Cycles Say About 2020?
— 1/21/20
-
 Modeling 2020 Expectations (Just For Fun)
— 1/13/20
-
 Tips From Real-World Wendy Rhoades
— 5/06/19
-
 The Best Recession Ever!
— 4/29/19
-
{[comment.author.username]} {[comment.author.username]} — Marketfy Staff — Maven — Member


