

Time To Stay Alert
Good Monday morning and welcome back. It's the start of a new week as well as the semi-official start of the second half of the year, so let's get right to our objective review the key market models and indicators and see where things stand. To review, the primary goal of this weekly exercise is to remove any subjective notions I might have in an effort to stay in line with what "is" happening in the markets. So, let's get started...
The State of the Trend
We start each week with a look at the "state of the trend." These indicators are designed to give us a feel for the overall health of the current short- and intermediate-term trend models.
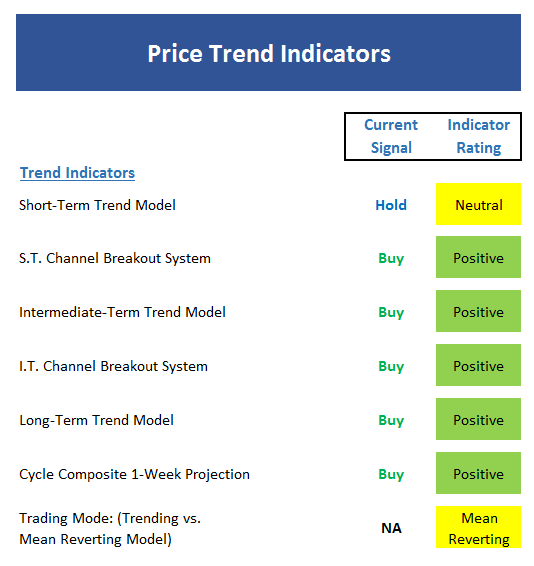
View Trend Indicator Board Online
Executive Summary:
- The short-term Trend Model is currently straddling the line between neutral and moderately negative. But since stocks don't go down anymore, we'll call it neutral...
- The short-term Channel Breakout System remains on a buy signal, but a confirmed close below 2405 would produce a sell signal
- The intermediate-term Trend Model remains positive, albeit by the slimmest of margins.
- The Short- and intermediate-term Channel Breakout System are on the same signals at this time. Thus, a close below 2405 turns both red.
- The long-term Trend Model is still in good shape here.
- The Cycle Composite points straight up for the next two weeks. However, after that, well, not so much.
- The Trading Mode models are currently conflicted, but two out of three suggest a mean reverting environment persists.
- In sum, the board's green hue is a bit misleading as almost any downside action from here would cause indicators to flip.
The State of Internal Momentum
Next up are the momentum indicators, which are designed to tell us whether there is any "oomph" behind the current trend...

View Momentum Indicator Board Online
Executive Summary:
- The short-term Trend and Breadth Confirm Model remains positive. However, we should note that since 2011, this mode hasn't produced the type of solid returns seen over the history of the model (since 1998)
- Our intermediate-term Trend and Breadth Confirm Model has done a good job of keeping traders on the right side of the major trend and remains positive.
- The Industry Health model reading actually pulled back a little last week and more importantly, has been going nowhere fast for quite some time. I believe this is an indication of narrowing leadership in an aging bull market.
- After showing some signs of life in the last few weeks, the short-term Volume Relationship model is now back to neutral.
- While still green, the intermediate-term Volume Relationship bears watching here as demand volume is close to breaking into a renewed downtrend.
- The Price Thrust Indicator slipped into the neutral zone last week.
- The Volume Thrust Indicator flipped to negative.
- The Breadth Thrust Indicator remains neutral.
- My takeaway from this board is despite decent price action, market momentum has been on the weak side.
The State of the "Trade"
We also focus each week on the "early warning" board, which is designed to indicate when traders may start to "go the other way" -- for a trade.
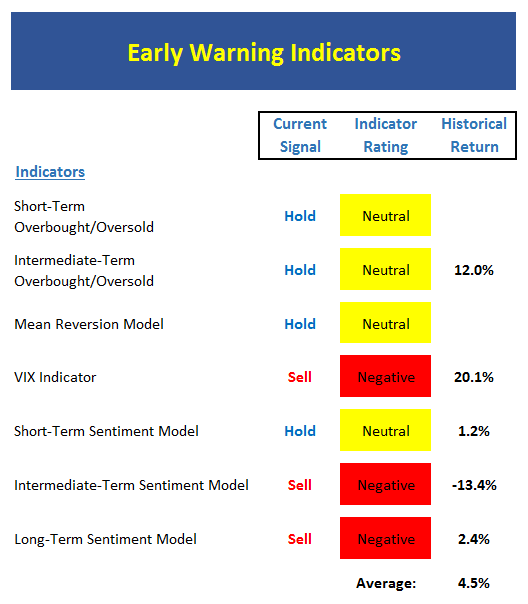
View Early Warning Indicator Board Online
Executive Summary:
- From a near-term perspective, stocks are neither overbought nor oversold.
- From an intermediate-term view, stocks are back in the neutral zone after another brief stint in overbought territory.
- The Mean Reversion Model remains neutral and moving toward a sell signal.
- Utilizing the VIX Indicator has been a tough go lately as signals have been few and far between. However, the current signal is a sell.
- From a short-term perspective, market sentiment remains neutral.
- No change, the intermediate- and long-term Sentiment models remain negative
The State of the Macro Picture
Now let's move on to the market's "external factors" - the indicators designed to tell us the state of the big-picture market drivers including monetary conditions, the economy, inflation, and valuations.
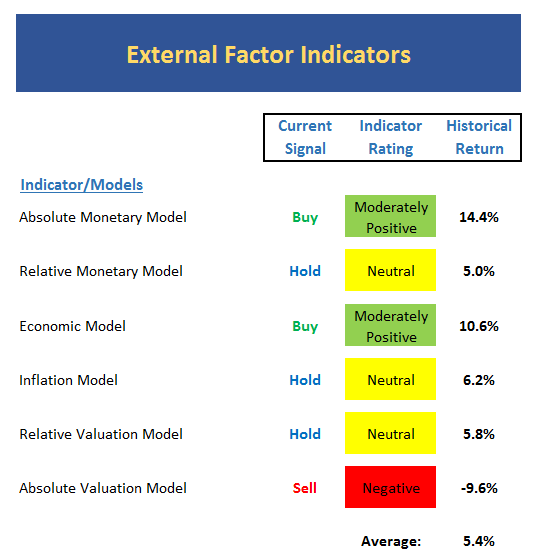
View External Factors Indicator Board Online
Executive Summary:
- Absolute Monetary conditions continue to improve. Although the recent spike in rates may start to bite here soon.
- On a relative basis, our Monetary Models have also been improving within the neutral zone. But if rates continue to rise, these models will undoubtedly reverse.
- Our Economic Model (designed to call the stock market) continues to improve.
- The Inflation Model is starting to warn of price pressures building a bit.
- Our Relative Valuation Model remains neutral but has upticked a bit lately.
- The Absolute Valuation Model remains negative.
The State of the Big-Picture Market Models
Finally, let's review our favorite big-picture market models, which are designed to tell us which team is in control of the prevailing major trend.
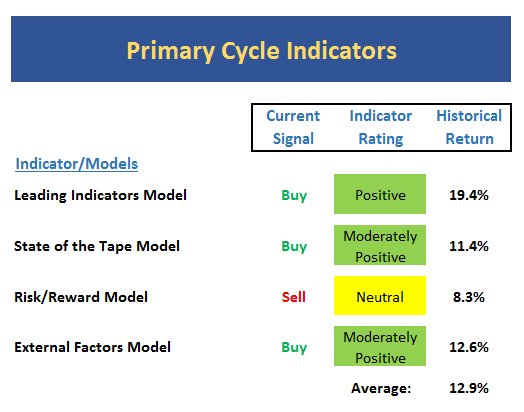
View My Favorite Market Models Online
Executive Summary:
- The Leading Indicators model, which was our best performing timing model during the last cycle, has flip-flopped over the past couple months and is now modestly positive.
- The Tape is basically remains moderately positive
- The Risk/Reward model remains on a sell signal, but the model reading is currently neutral.
- The External Factors model continues to show signs of improvement, which is a long-term positive.
The Takeaway...
My takeaways from the indicator boards this week include: (1) The trend indicators are not as strong as they look and if tech begins to lead to the downside, the bears could take control. (2) We've likely seen "peak momentum" for this cyclical bull as the momentum indicator readings remain lackluster. Note that momentum peaks traditionally lead price peaks and as such, we should take any meaningful declines in price seriously. (3) Our monetary models have improved lately, but the trend could easily reverse if the recent 8-day spike in rates continues. (4) As I've been saying, the cycle projection calls for a meaningful decline to begin in the next few weeks. So... I, for one, am going to stay alert here during the traditionally slow summer season as I continue to believe that risks are elevated at this time.
Thought For The Day:
Just because you can, doesn't mean you should.
Current Market Drivers
We strive to identify the driving forces behind the market action on a daily basis. The thinking is that if we can both identify and understand why stocks are doing what they are doing on a short-term basis; we are not likely to be surprised/blind-sided by a big move. Listed below are what we believe to be the driving forces of the current market (Listed in order of importance).
1. The State of the U.S. Economic Growth (Fast enough to justify valuations?)
2. The State of Earnings Growth
3. The State of Trump Administration Policies
Wishing you green screens and all the best for a great day,

David D. Moenning
Chief Investment Officer
Sowell Management Services
Disclosure: At the time of publication, Mr. Moenning and/or Sowell Management Services held long positions in the following securities mentioned: none. Note that positions may change at any time.
Looking for a "Modern" approach to Asset Allocation and Portfolio Design?
Looking for More on the State of the Markets?
Disclosures
The opinions and forecasts expressed herein are those of Mr. David Moenning and may not actually come to pass. Mr. Moenning's opinions and viewpoints regarding the future of the markets should not be construed as recommendations. The analysis and information in this report is for informational purposes only. No part of the material presented in this report is intended as an investment recommendation or investment advice. Neither the information nor any opinion expressed constitutes a solicitation to purchase or sell securities or any investment program.
Any investment decisions must in all cases be made by the reader or by his or her investment adviser. Do NOT ever purchase any security without doing sufficient research. There is no guarantee that the investment objectives outlined will actually come to pass. All opinions expressed herein are subject to change without notice. Neither the editor, employees, nor any of their affiliates shall have any liability for any loss sustained by anyone who has relied on the information provided.
The analysis provided is based on both technical and fundamental research and is provided "as is" without warranty of any kind, either expressed or implied. Although the information contained is derived from sources which are believed to be reliable, they cannot be guaranteed.
David D. Moenning is an investment adviser representative of Sowell Management Services, a registered investment advisor. For a complete description of investment risks, fees and services, review the firm brochure (ADV Part 2) which is available by contacting Sowell. Sowell is not registered as a broker-dealer.
Employees and affiliates of Sowell may at times have positions in the securities referred to and may make purchases or sales of these securities while publications are in circulation. Positions may change at any time.
Investments in equities carry an inherent element of risk including the potential for significant loss of principal. Past performance is not an indication of future results.
Advisory services are offered through Sowell Management Services.
Recent free content from FrontRange Trading Co.
-
 Is The Bull Argument Too Easy These Days?
— 8/31/20
Is The Bull Argument Too Easy These Days?
— 8/31/20
-
What Do The Cycles Say About 2020?
— 1/21/20
-
Modeling 2020 Expectations (Just For Fun)
— 1/13/20
-
Tips From Real-World Wendy Rhoades
— 5/06/19
-
The Best Recession Ever!
— 4/29/19
-
{[comment.author.username]} {[comment.author.username]} — Marketfy Staff — Maven — Member


- 1 Campus Martius, Suite #200Detroit, MI 48226
- +1 877 440 9464