

Critical global markets technical update for our readers & friends!!
BREXIT VOTE LEADS TO FAST AND FURIOUS DOWNSIDE ACTION
Here are some random observations before we get into today’s analysis:
- Brexit vote done… out the Brits will go.The realization of that fact is causing uncertainty globally and is forcing the masses of strategists back to the drawing board to recalculate all their assumptions about the future.
- Thus far, we’ve seen an obvious reversing of positions and the first wave of margin calls.There will be more of those calls before the day is out and into the early part of next week.The calls will be arriving on the desks and in the emails of those caught long of stocks and crude oil and those who may have been short of gold – not to mention in the forex markets.
- Trading today is only to be done by the brave of heart and by the “falling knife catchers” out there.For the rest, the best policy is to cover naked shorts, maybe keep some hedges on against long risk asset positions and to gather cash if possible for the next whoosh lower.
- We at The Factor are not economists and do not pretend to be so in any forum.We just look at the charts for clues as to what may lie ahead for the futures contracts we follow.So, we’ll refrain from any comment on whether the news is good or bad in the long run.Obviously, based on the initial reaction, the news is bad for risk assets in the short-run.
- Let’s go the charts for a look at how the coming week may play out…
S&P futures test downside technical boundaries post-Brexit
Recap of last week’s thoughts on the S&P e-Mini Futures:
We gave resistance at 2079 and 2100 and recommended buying near support and selling at resistance.
Here’s an updated chart of the S&P e-Mini Futures:
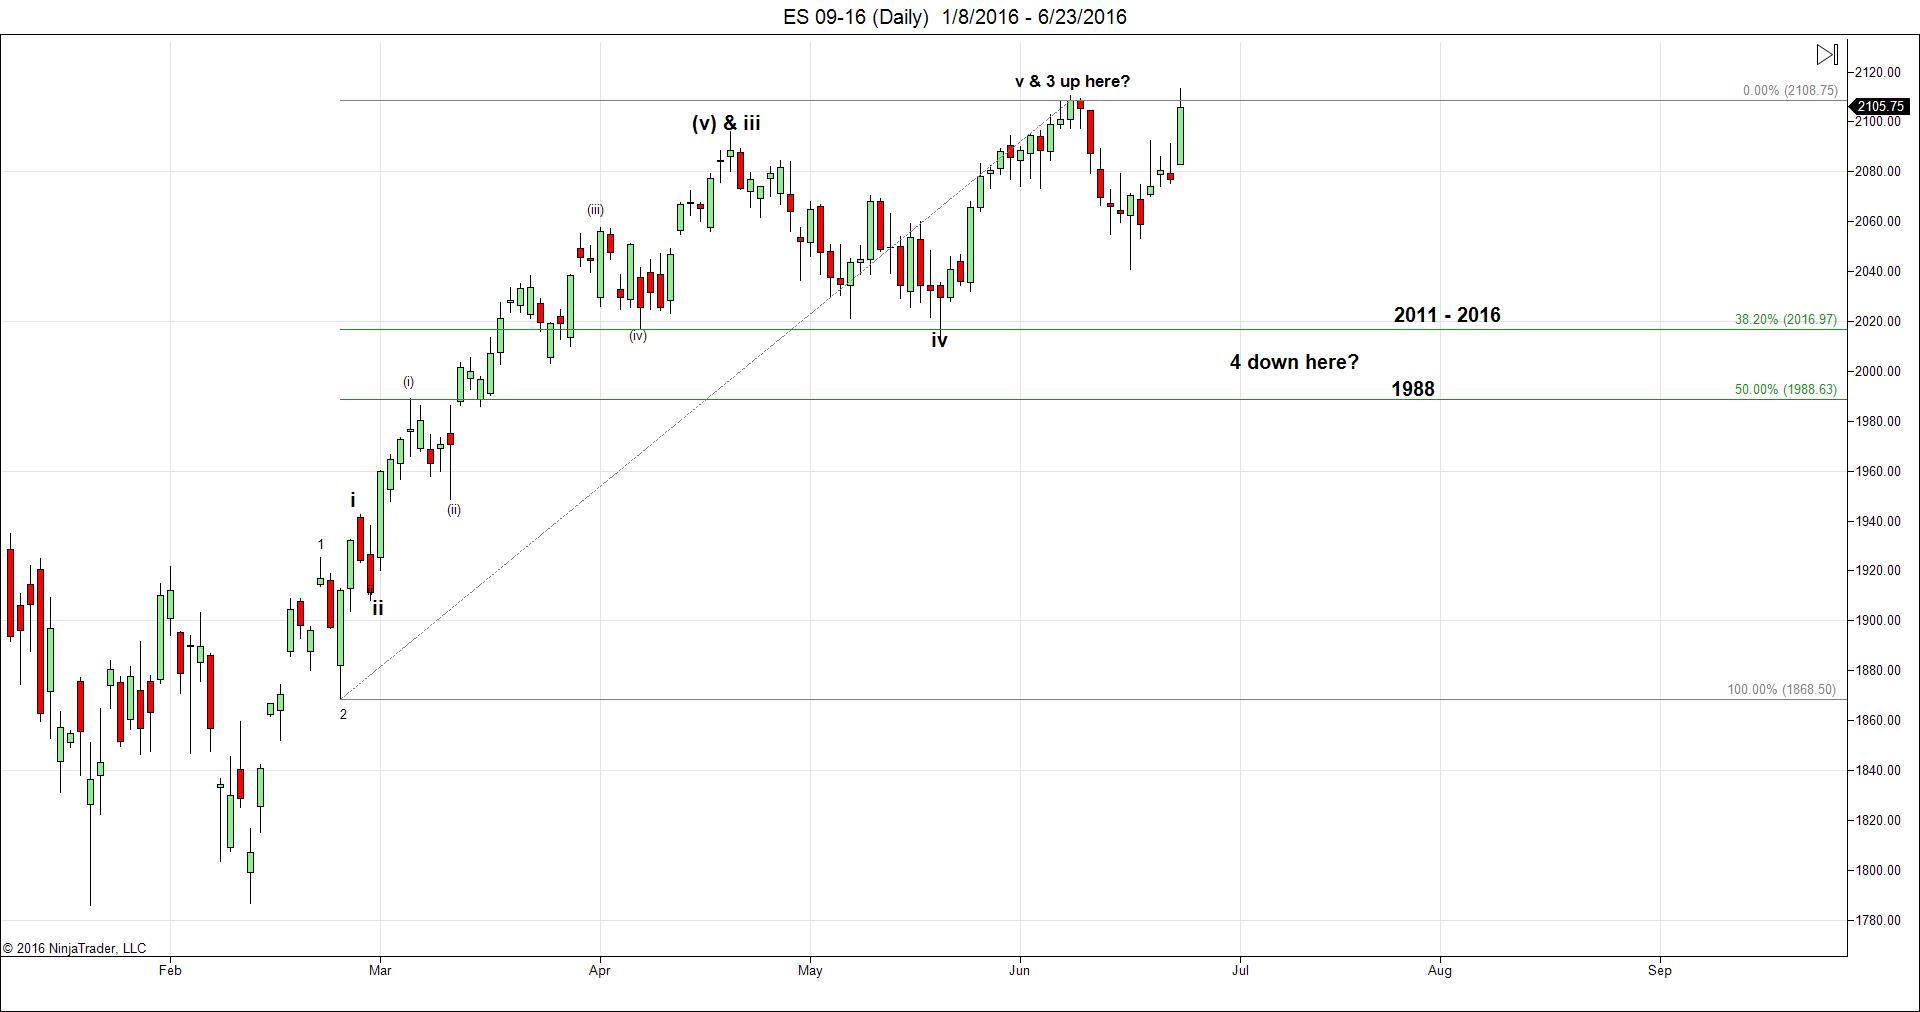
The S&P futures bottomed out at 1999 at around 1am EST early Friday morning after the Brexit news was released.
We were calling for 1999 as the lower of two possible downside targets in our recent reports.There’s no way we felt the decline would happen in a matter of hours, though.
Given the pattern formation that has occurred in the last 48 hours, we went back to the ES chart to double-check our wave count for accuracy and to consider all possible scenarios.
The chart above shows the action prior to the Brexit news and a revised wave count (from previous weeks and months of Factor reports).
Based on this count, we would be looking for the current down wave (wave “4”) to bottom out at either 2011 – 2016 or down at 1988.
We will be watching Friday afternoon to see if 2068.25 holds as resistance for any bounce off of the lows.If it does, then we believe 1988 will be tested.If it doesn’t, then look for a move back up to 2106 – 2120.
We will be looking to try bearish bets at 2068 with stops on any 15-minute close above 2068.26 and with a downside target of 1988.If 2068.25 is violated, we’ll re-enter on the short side at 2120.
We would not be buyers of ES futures at this point.Only down at 1988 would we consider getting long of stocks / stock futures.
Gold completes textbook “abc” downside correction and then explodes higher
Recap of last week’s thoughts on gold:
- Gold futures rallied past previous resistance and made it up to 1307 before retreating..
- We gave three potential support levels for gold based on Fibonacci analysis (but cautioned that they were “low conviction” levels) – 1286, 1277 and 1268.
- We cautioned that any break below 1268 would lead to a test of 1240 and possibly even 1200.
- On the upside, we noted that resistance came in at the April / May peak at 1307.30, last week’s high of 1318.90 and gave the next projected high of 1328.
- We did share this note of caution, “With the uncertainty around the “Brexit” situation in Europe, the currency markets are very volatile and unpredictable – leading to similar uncertainty in the gold and silver markets.Be careful!”
Here’s an updated chart of gold:
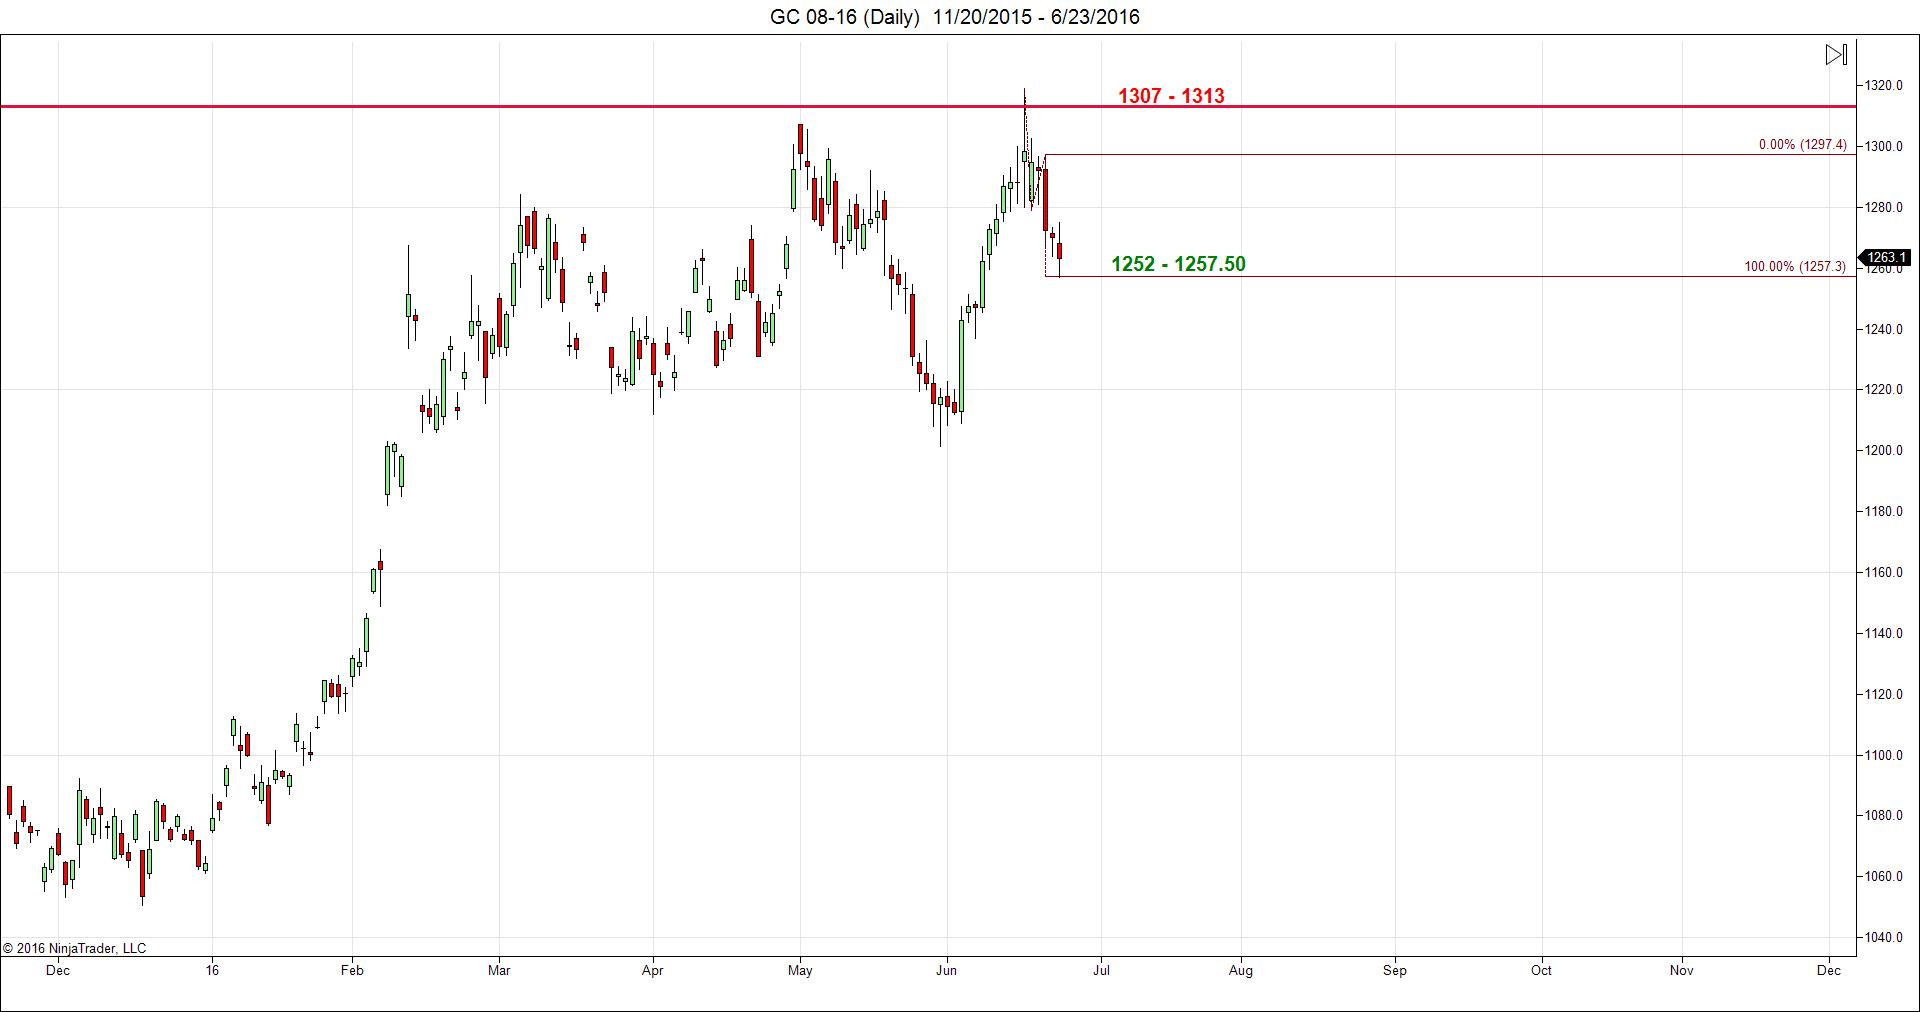
The chart above shows gold as having possibly completed an “abc” downside correction at around 1253 – 1257 leading up to the Brexit news.The news has obviously propelled gold shorts to cover and global macro players to pile in on the long side.
Prior to the news, we would have put the potential upside targets for gold up at 1307 – 1313.At noon EST on Friday, gold is up nearly $60 to just above $1322.
We would be sellers of gold at these levels – at least taking profits on long bets.Those brave souls out there might consider shorting gold up here.However, only do so with stops being honored on any close above 1313 and use as your downside target the 1210 – 1220 area.
We would not be starting new long positions here and would not consider doing so until at least 1220 is tested on the downside.
Special Weekly Feature:Brexit-induced risk-off move is crushing crude oil
Recap of last week’s thoughts on CRUDE OIL FUTURES:
- Copper has been trading lower recently, but we noted it seemed to be trying to hold support at the key level of 2.027.We suggested getting long near 2.027 with stops in place just below that level and with an upside target of 2.3565.We noted we would not be short of copper again unless and until 2.027 is violated on the downside on a closing basis.Update on Copper:Copper traded all the way down to 2.06 and change Friday morning before bouncing back to 2.11.So far, key support at 2.027 has held.
Here’s an updated chart of this week’s feature – CRUDE OIL FUTURES:
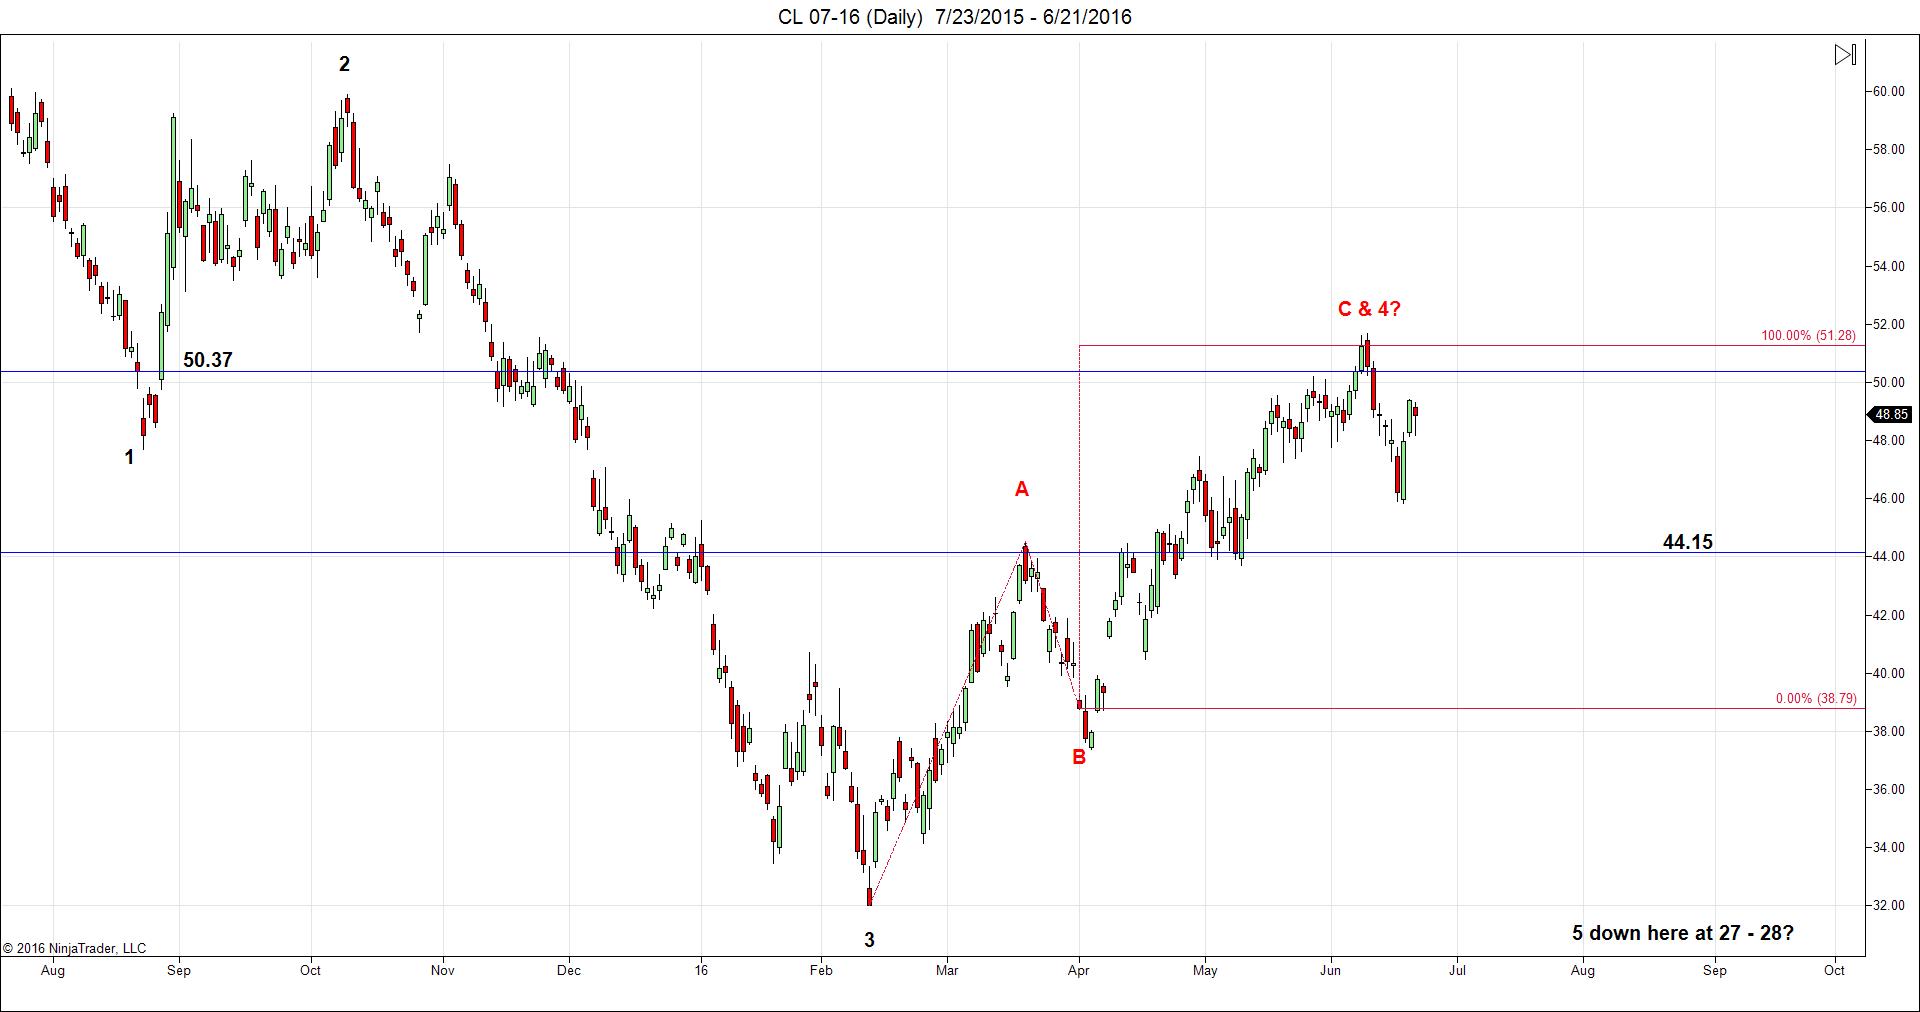
We have seen a decline, a bounce and now another decline with today’s lows touching $46.70.
The projected support range for this mini-bear move comes in at $44.53 to $44.70 – with an extended move testing $44.15 on the downside. That last level has to hold for the bulls to have hope in the short to intermediate-term.
We would be looking to buy crude oil down at $44.53 with stops in place on any close below $44.15 and would have as our upside target the $50 level.
We would only be looking to short crude oil again if it either made it back up to $51.28 or if it closed below $44.15.
In the former case, we would use any close above $51.28 as a stop loss trigger and would have a longer-term bearish target of $29. In the latter case, we would wait for a bounce following the break below $44.15 and would have to then establish a new stop-loss trigger – but would also have $29 as the downside target.
Coffee setting up for lower pricesRecap of last week’s thoughts on coffee:
- Coffee futures looked like they were bouncing ahead of more downside.We viewed key resistance for the bears as being 144.75.
- We recommended getting short of coffee as close to 144.75 as possible with stops in place on any daily close above that level.We gave 116 as our downside target.
- We cautioned against buying coffee for the time being.
Here’s an updated chart of coffee futures:
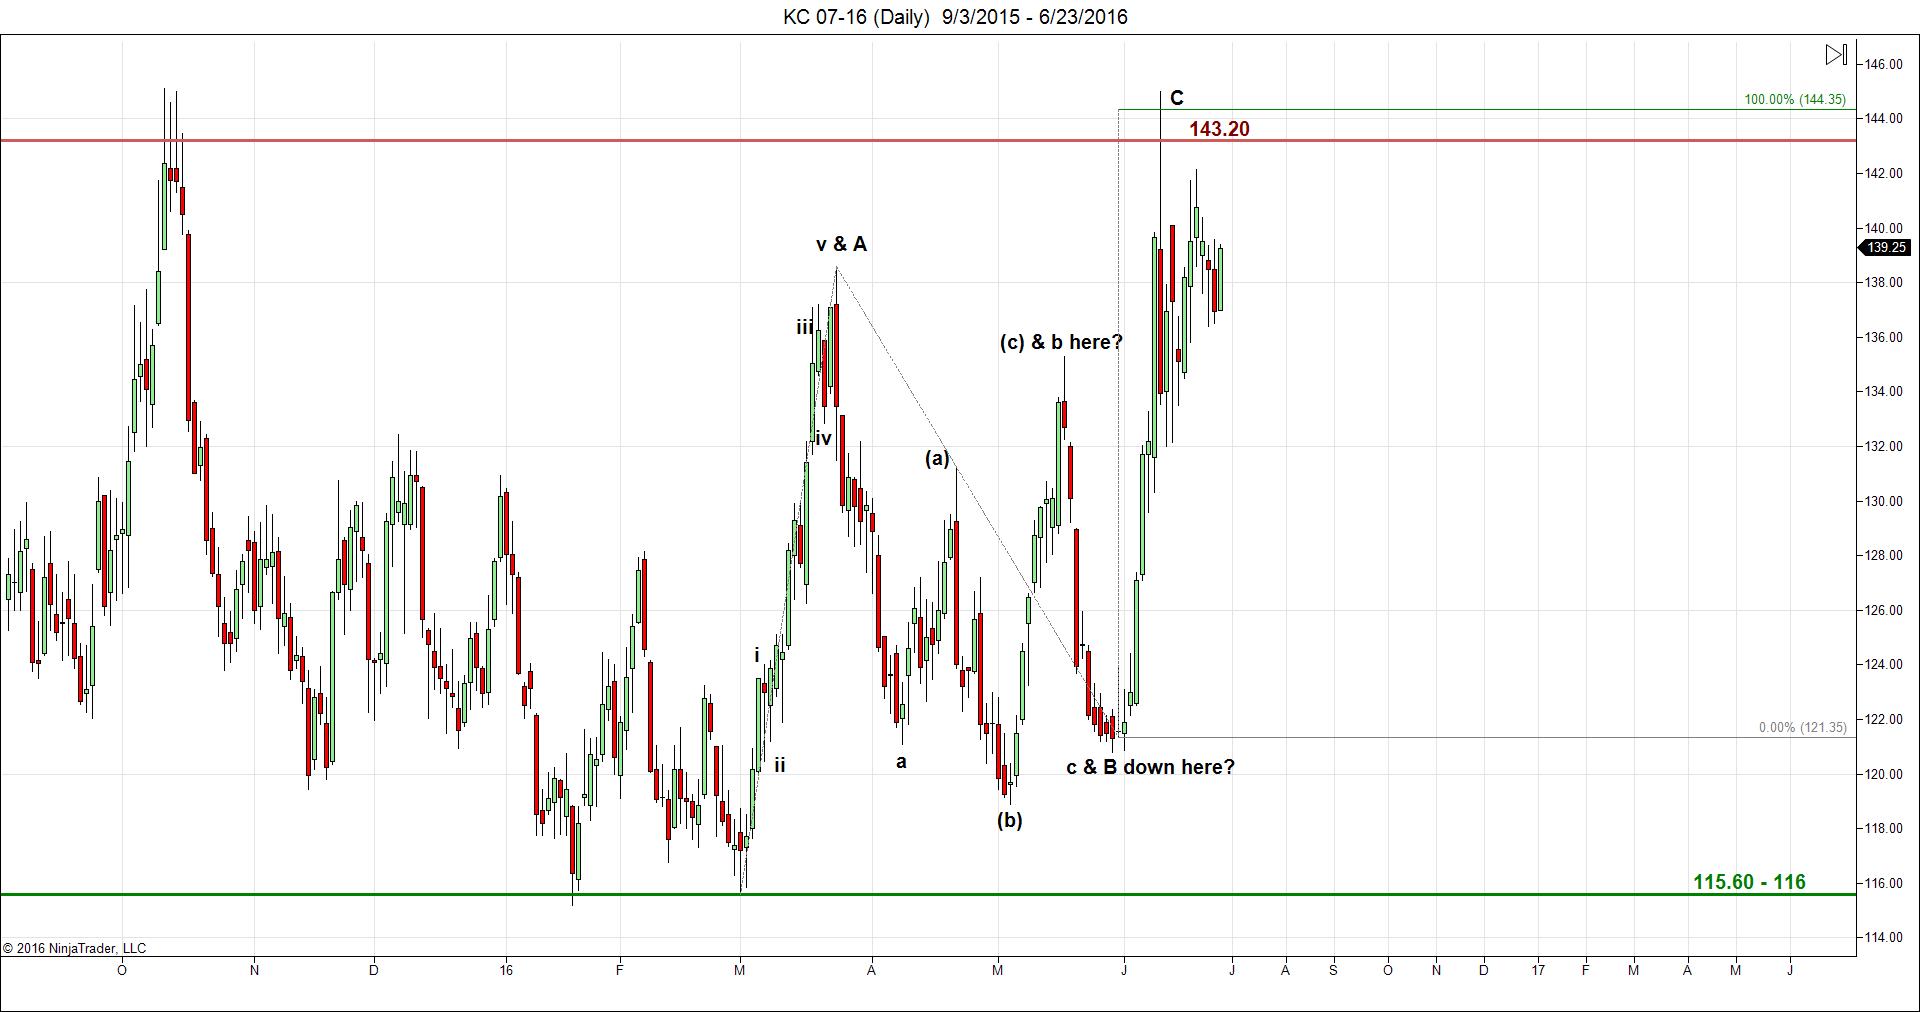
There has not been much of a change in the chart of coffee this week.We still beleve lower prices are looming in the near future and that selling bounces is the way to play coffee.
We would be using any bounce up to 143.20 as an impetus to sell coffee futures aggressively.We would honor stops on any close above that level and will be targeting 116 on the downside.
No buying of coffee futures for the time being.
Sugar sitting right at short-term support
Recap of last week’s thoughts on sugar:
- We felt sugar’s short-term top would continue to hold at 19.92 – 20 and a downside correction was commencing that would take prices down to 18.58 or 18.17.
- We noted we would continue to sell sugar near 19.92 with stops in place on a daily close above 20 and with downside profit-taking targets at either 18.58 or 18.17.
- We further noted we would only be looking to buy sugar near 18.17 ideally with stops in place on any close below 18.17 and with an upside target of 19.95.
Here’s an updated chart of sugar futures:
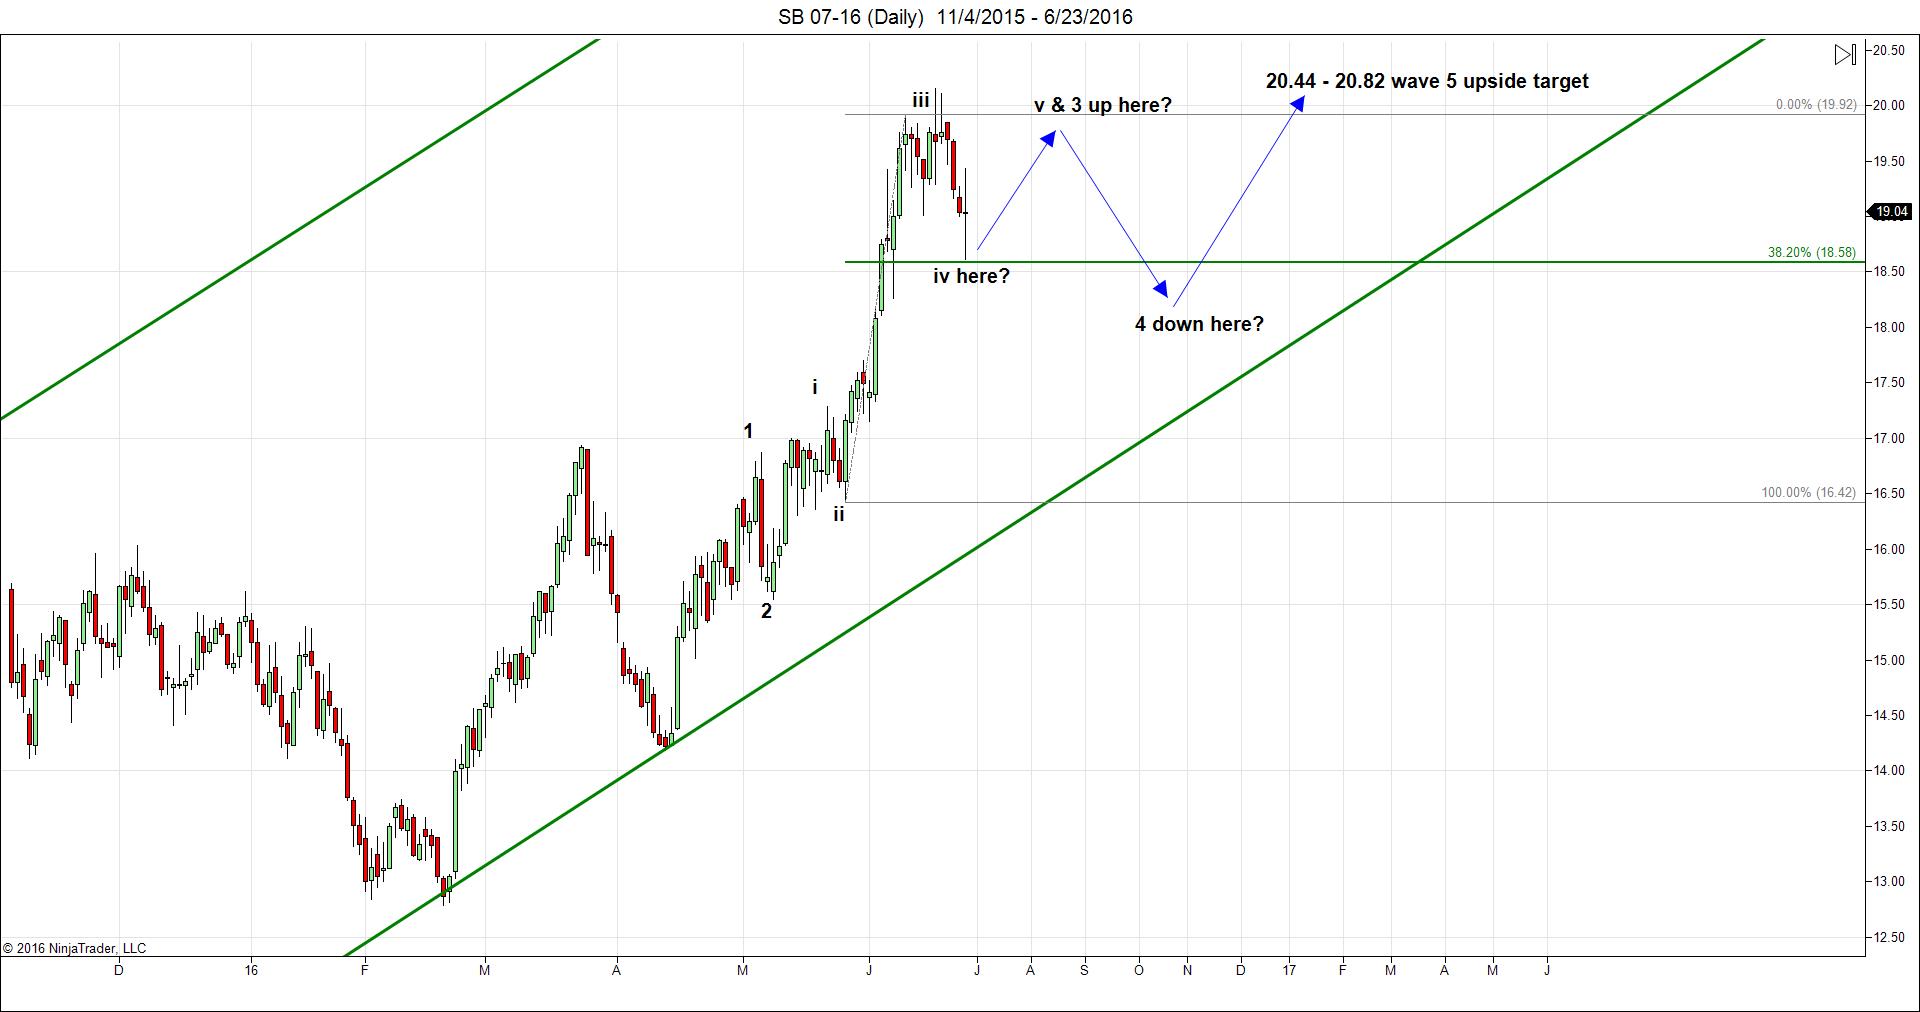
Sugar futures traded down to projected short-term support at 18.58 (and slightly below) this week and again on Friday morning.So far, that support level has held up.
We continue to think buying sugar near 18.58 is a good play (prior to an up move to 19.92).We would use any close below that level as a stop loss trigger and would use 19.92 as an upside target.
We would not be shorting sugar until at least 19.92 and would honor stops on any daily close above that level.The downside target for any such trade will be the 18.25 level.
After the up move to 19.92 and the subsequent down move to 18.25, we would be looking to buy again at 18.17 and would honor stops on any close below that level and would have a new upside target of 20.44.
Soybean Meal set to test downside support levels
Recap of last week’s thoughts on Soybean Meal:
- Soybean meal futures were trading lower after hitting 432.80 resistance in the previous week.
- We felt they would continue lower to either 374 or 340.
- We suggested shorting SM futures at or near 414.30 with stops in place on any close above 415 and with a downside target of 375.
- We noted we would only be looking to buy aggressively into SM futures at 340 with stops in place on any close below 340 and with an upside target of 420.
Here’s an updated chart of Soybean Meal:
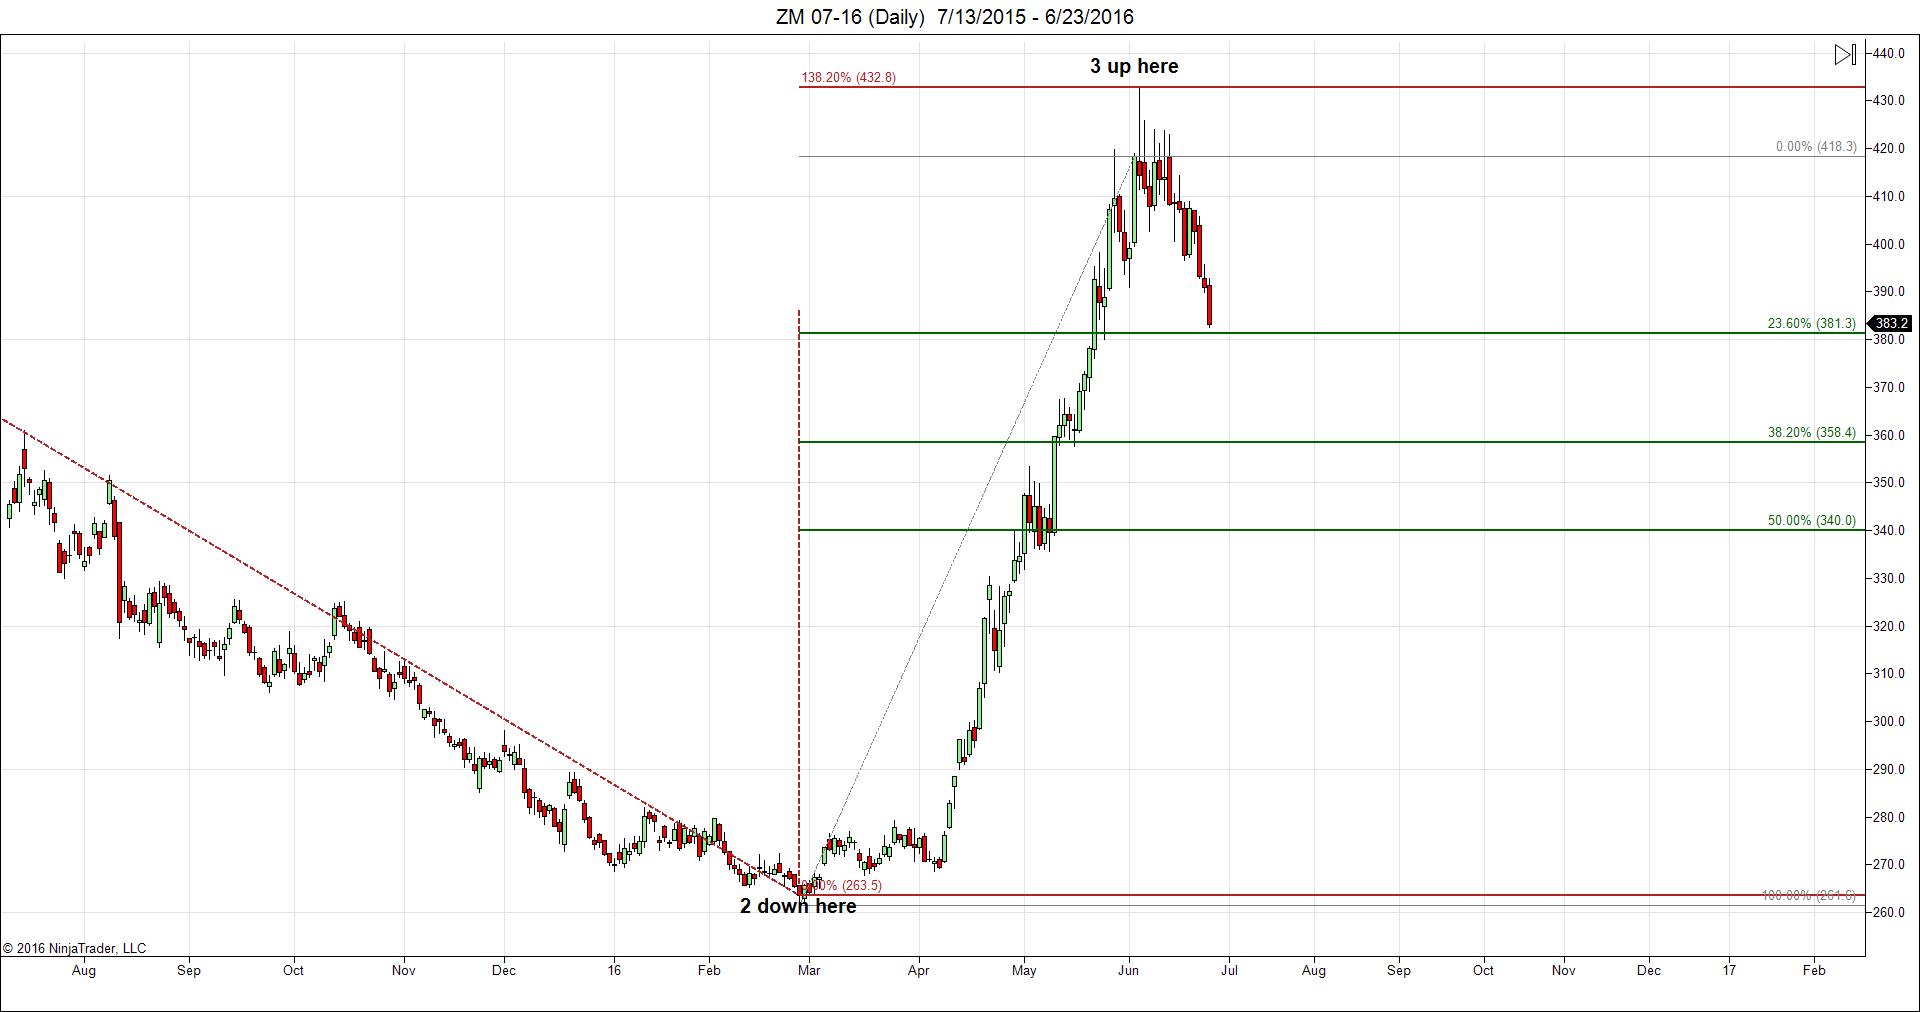
Soybean meal continues to fall, but is trying to find solid ground so it can possibly stage another rally attempt.
We are seeing possible Fibonacci support at one of three levels – 381.30, 358.40 or 340.All of those levels correspond with horizontal lines of support created by previous price pivots and trading congestion.
In this environment, we would only be looking to buy SM futures down at 340 with stops in place on any close below 340 and with an upside target of 418.
We would hold off on shorting SM futures right now as they’re already reaching oversold levels and could be poised for a sharp rally.
Wheat cascading lower and reaching oversold levels.Time to buy? Or simply wait to short?
Recap of last week’s thoughts on wheat:
- Wheat futures were trading sharply lower after being rejected at 521 resistance in previous weeks.
- We gave a minimum downside target of 450, but noted 425 was easily in play.
- We suggested shorting wheat at 490 with a downside target of 450.
- We gave 400 as an ideal buy target for wheat.
Here’s an updated chart of Chicago Wheat:
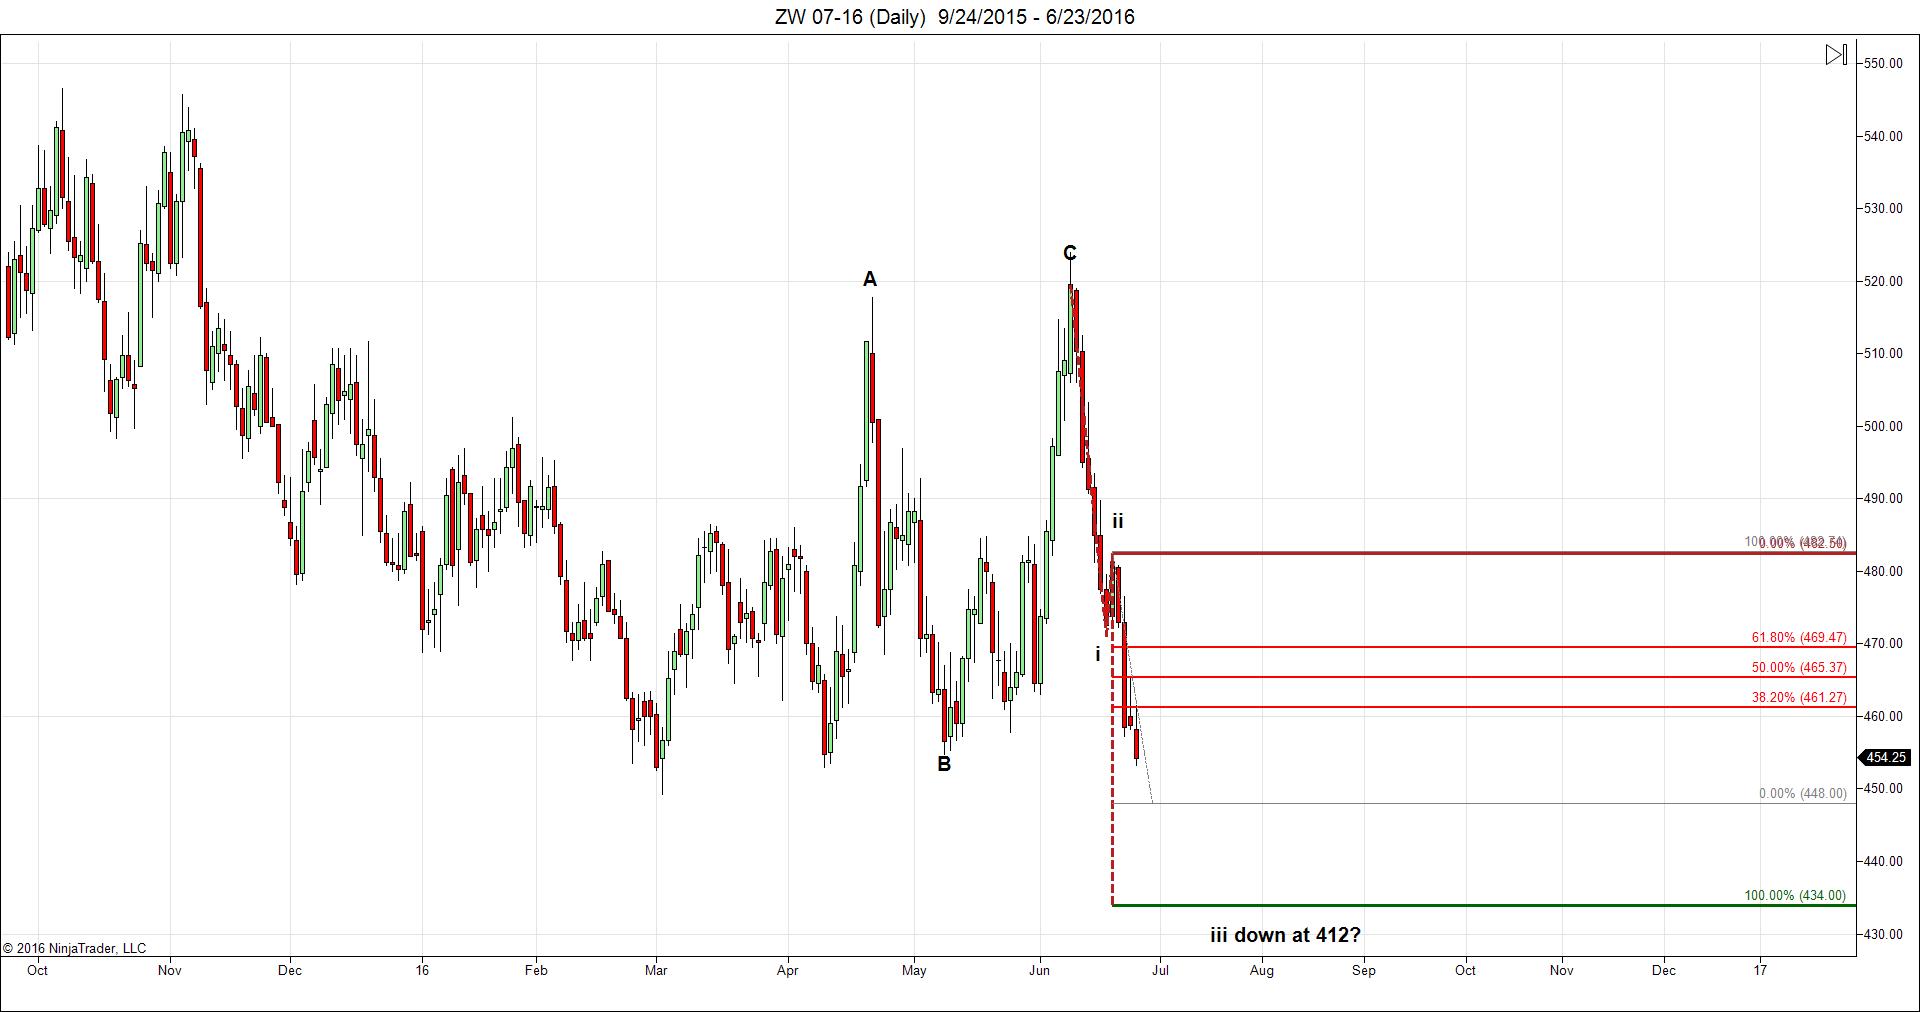
The chart of wheat futures is bearish in every sense of the word and on pretty much all timeframes.
We see wheat eventually making it down to between 400 and 413 by the end of this down wave.
We would be using any short-term bounces in wheat up to either 457, 462 or 467 to initiate new short positions in wheat in anticipation of the move down to 413.Use stops on any daily close above 458, 463 or 468.
We will only be looking to buy wheat futures on a test of 400.Use 470 as an upside target in that case.
Corn moving lower in a big way – will it continue?
Recap of last week’s thoughts on corn:
- Corn futures were consolidating recent gains and were trying to hold support at 421.
- We suggested buying corn near 421 with stops in place on any close below 420 and with an upside target of 465.
Here’s an updated chart of corn futures:
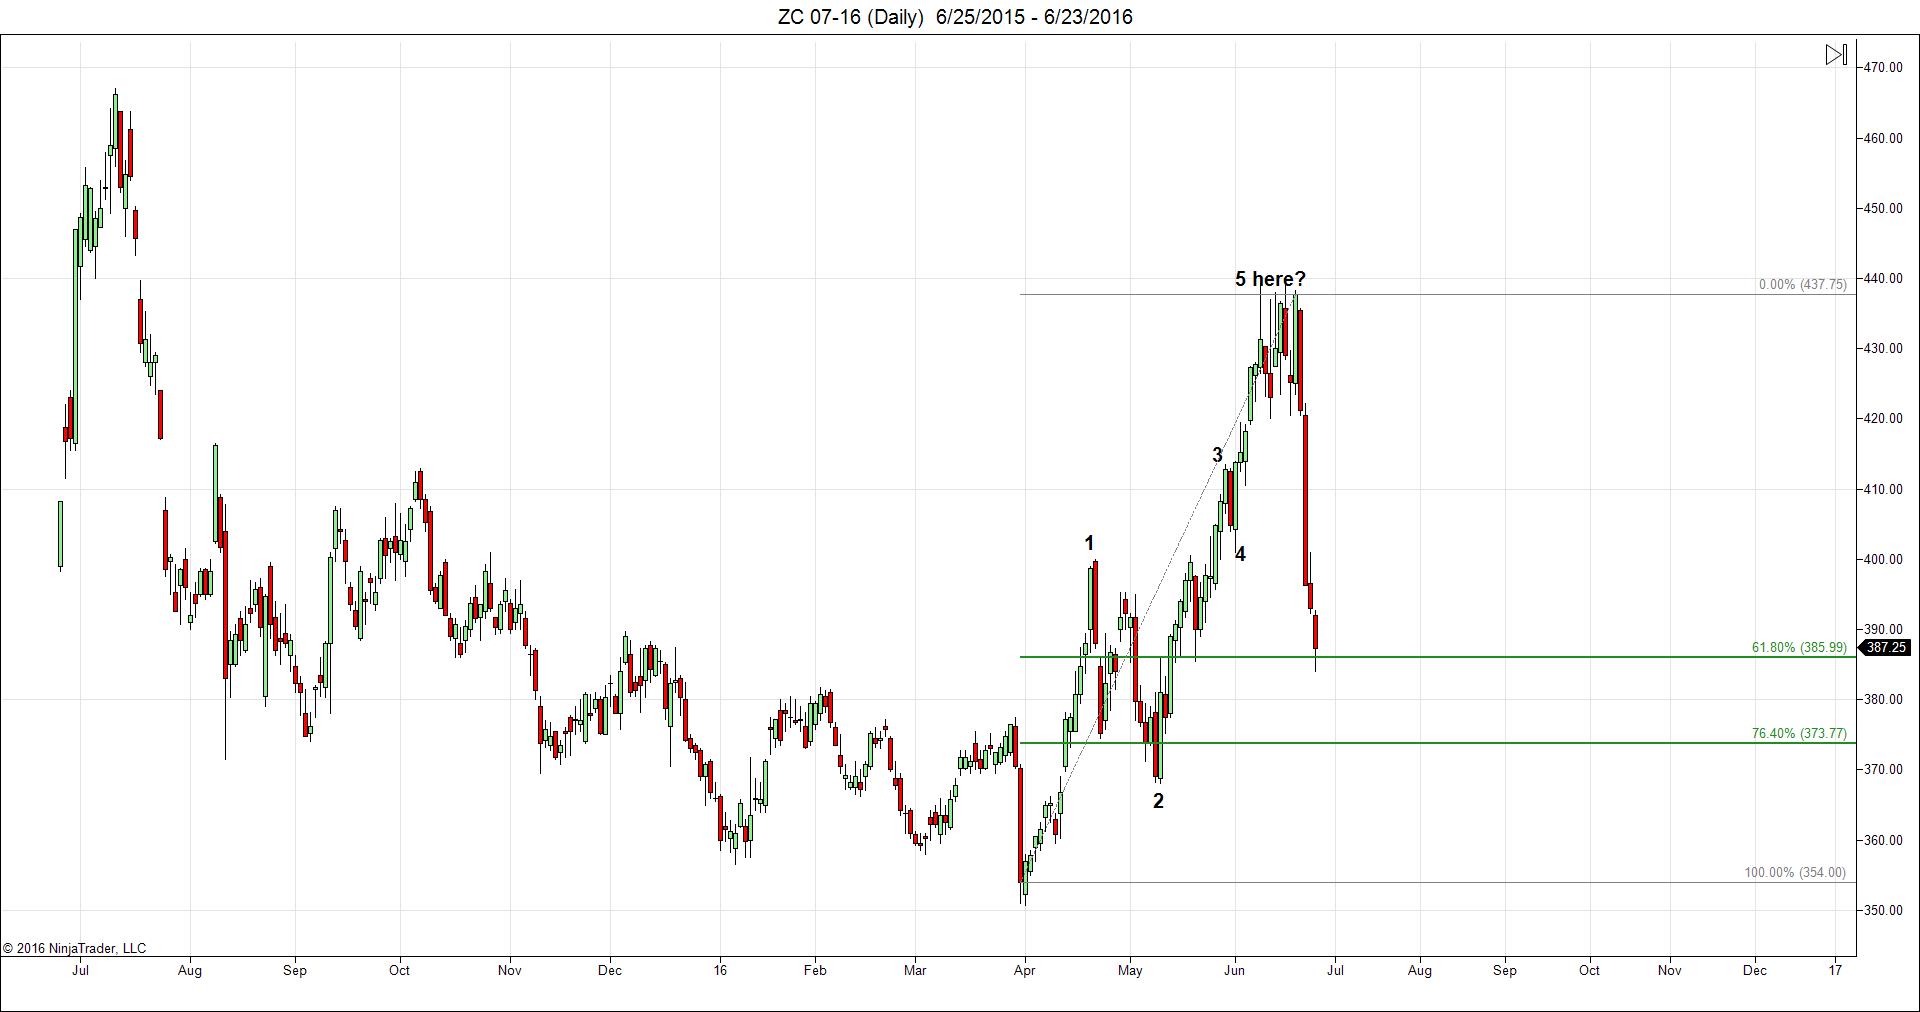
Corn has been knifing lower through several potential support levels and has this Friday been testing the lower two “reasonable” support levels at 384 and 374.
Corn should, in theory, bounce off of one of those two levels and recover some of this week’s losses.A bounce up to 414 could take place assuming the 374 support level holds.
We would be looking to buy corn at 374 with stops in place on any close below 372 and with an upside target of 414.
We woud only be looking to short corn on a bounce back up to 414.We would use stops on any close above 415 and will have 360 as our downside target.
Soybeans may be very early in their next big down wave
Recap of last week’s thoughts on soybeans:
- Soybean futures posted a bearish reversal candle on the weekly chart last week and appeared poised to begin a long-term downtrend with the ultimate downside target range being 725 – 750.
- We suggested shorting bounces up to 1201.75 with stops in place on any daily close above 1205.The downside target would be 725 in the long-term.
Here’s an updated chart of soybeans:
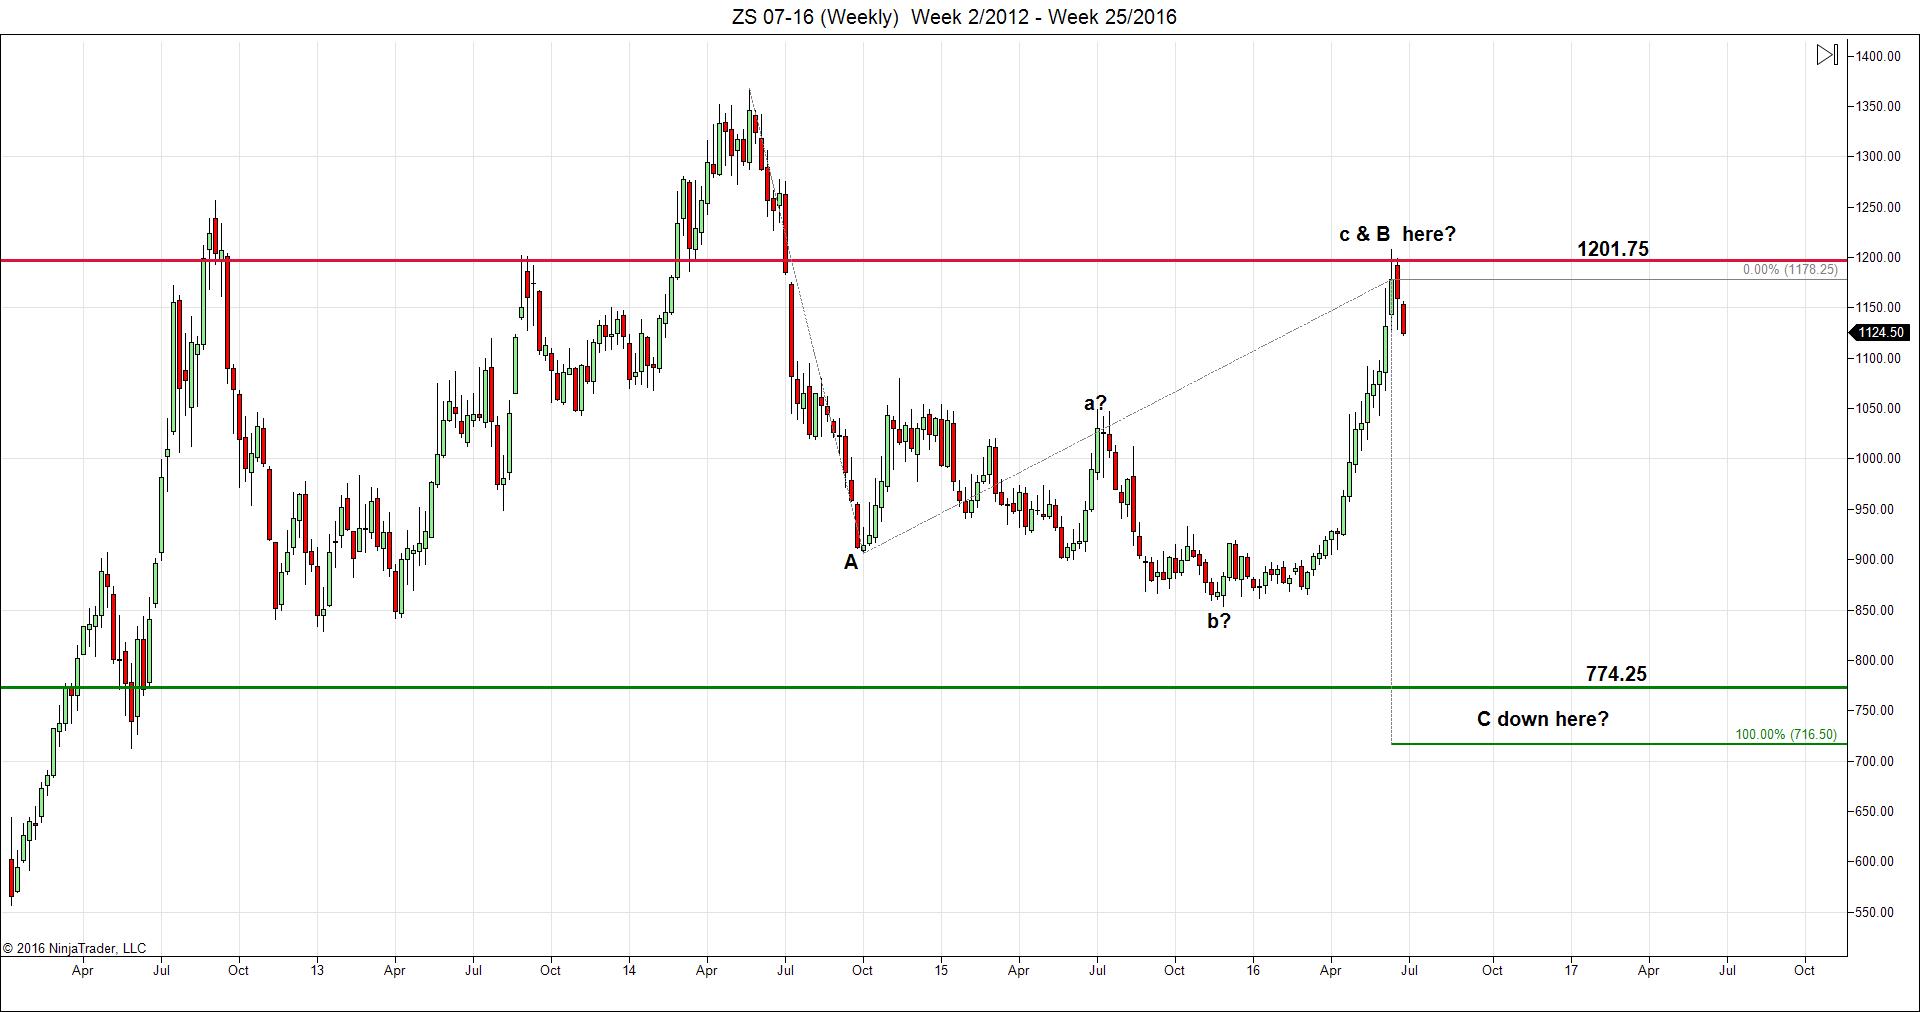
IMPORTANT NOTE: We are now using the chart of the July 2016 soybeans contract in this week’s report as it is the most critical / important of all the upcoming contracts AND its chart is vastly different from the continuous chart (rendering the analysis of that continuous chart less than useful in our opinion).
Soybeans are continuing lower after seemingly setting a solid resistance / ceiling up at 1201.75.
Beans now appear poised to continue their trend down to either 774 or 720 over the intermediate to long-term.
We will be looking to short rallies in beans up to either 1154 or 1167 with stops in place on any closes above 1155 and 1167 respectively.The downside target in the short-term will be 1015.
We would not be buyers of dips in beans for the time being.
SUMMARIZING TODAY’S ANALYSIS:
S&P e-Mini futures (@ES) touched downside projection from last week and bounced.Sell rallies to 2068.25 Friday / Sunday / Monday with stops on any 15 minute close above that level and with 1988 as a downside target.
Gold (@GC) should stop Friday’s rally and tumble back down.Take profits on longs and gingerly look to short – but honor stops!!
Crude oil getting slammed along with other risk assets following Brexit.Buy very close to projected support and only sell into rallies to projected resistance – nothing in between.
Coffee (@KC) still setting up for more downside. Sell near resistance.
Sugar (@SB) are trying to hold support in the short-term.Buy very close to suppor and only sell once upside targets are met.
Soybean Meal (@SM) continue lower, but could bounce sharply.Sell at resistance and only buy very close to potential support.
Chicago Wheat (@W) is in freefall after running into “correction resistance”.Sell rallies!
Corn futures (@C) could bounce off of oversold conditions and Fibonacci support levels.
Soybeans (@S) appear to be early in a long-term downtrend.Sell rallies to resistance!
That does it for this week’s report.
* There is a substantial risk of loss in trading futures and options. The information and data in this report were obtained from sources considered reliable. Their accuracy or completeness is not guaranteed and the giving of the same is not to be deemed as an offer or solicitation on our part with respect to the sale or purchase of any securities or commodities. Fintec Group. its officers, directors, employees and brokers may in the normal course of business have positions, which may or may not agree with the opinions expressed in this report. Any decision to purchase or sell as a result of the opinions expressed in this report will be the full responsibility of the person authorizing such transaction.
Recent free content from Peak Analytics & Consulting
-
 S&P futures may see short-term bounce ahead of test of 4,005
— 8/26/22
S&P futures may see short-term bounce ahead of test of 4,005
— 8/26/22
-
NASDAQ futures update...
— 3/08/22
-
AAPL historical pattern could lead market lower
— 8/03/20
-
UPDATED S&P FUTURES LEVELS BASED ON TODAY'S ACTION...
— 12/20/18
-
Headed to 2412 - 2417
— 12/20/18
-
{[comment.author.username]} {[comment.author.username]} — Marketfy Staff — Maven — Member
Reviews


- 1 Campus Martius, Suite #200Detroit, MI 48226
- +1 877 440 9464