

Short-term outlook for stocks
We are hitting the lower edge of our projected upside resistance range now.
We now feel - based on the patterns / waves that have traced out on the chart - that the market will top at or very near current levels just under 2100 and start the ultimate topping process for this move. See the chart below for the updated wave count and projected moves:
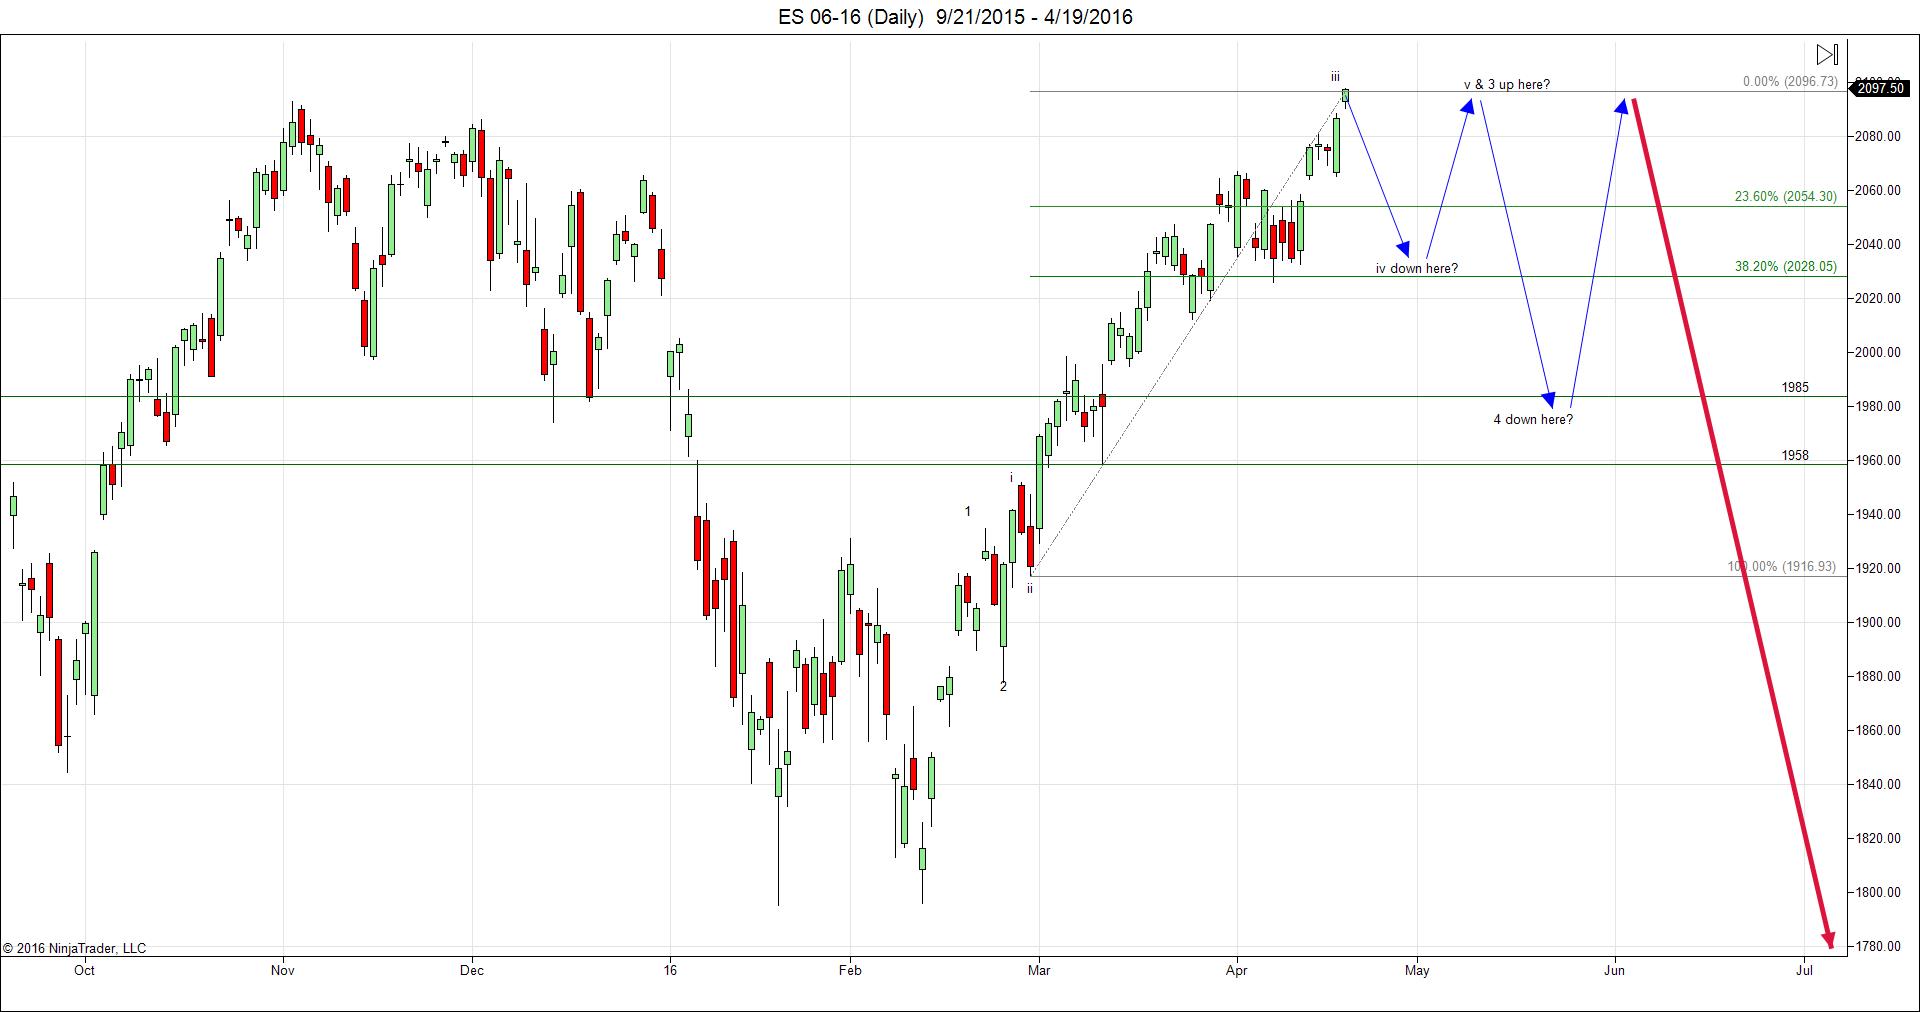
We should top here / close to here and then pull back to 2050 at least and likely to 2025.
We should then bounce back up to near 2100.
We should then pull back a bit further to either 1985 or 1958.
Then, one more test of the upside target range of 2095 - 2160.
Then, look out below.
Of course, we'll adjust things based on where the actual tops are made, but this seems to be a pretty good general forecast.
Recent free content from Peak Analytics & Consulting
-
 S&P futures may see short-term bounce ahead of test of 4,005
— 8/26/22
S&P futures may see short-term bounce ahead of test of 4,005
— 8/26/22
-
NASDAQ futures update...
— 3/08/22
-
AAPL historical pattern could lead market lower
— 8/03/20
-
UPDATED S&P FUTURES LEVELS BASED ON TODAY'S ACTION...
— 12/20/18
-
Headed to 2412 - 2417
— 12/20/18
-
{[comment.author.username]} {[comment.author.username]} — Marketfy Staff — Maven — Member
Reviews


- 1 Campus Martius, Suite #200Detroit, MI 48226
- +1 877 440 9464